Dashboard
With a Operating Losses, the company has a Weak Long Term Fundamental Strength
- Poor long term growth as Operating profit has grown by an annual rate of -189.99%
- PAT(Q) At Rs -3.49 cr has Fallen at -1889.7% (vs previous 4Q average)
- PBDIT(Q) Lowest at Rs -4.72 cr.
- PBT LESS OI(Q) Lowest at Rs -5.37 cr.
Stock is technically in a Mildly Bearish range
Risky - Negative Operating Profits
Underperformed the market in the last 1 year
Stock DNA
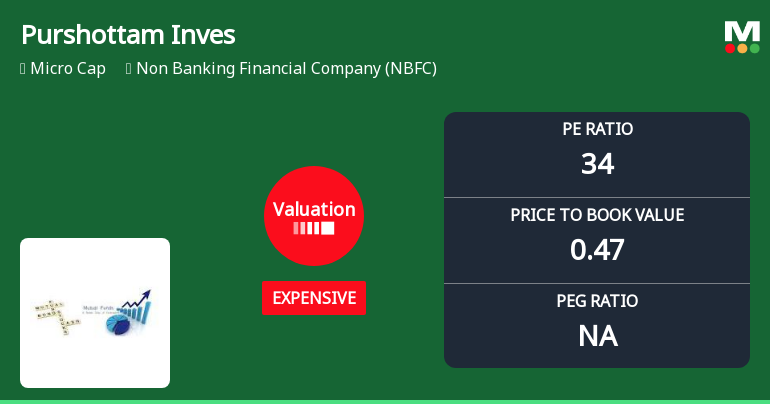
Non Banking Financial Company (NBFC)
INR 25 Cr (Micro Cap)
NA (Loss Making)
21
0.00%
0.34
-3.89%
0.45
Total Returns (Price + Dividend) 
Purshottam Inves for the last several years.
Risk Adjusted Returns v/s
Returns Beta

News
Purshottam Investofin Ltd Valuation Shifts Signal Caution for Investors
Purshottam Investofin Ltd, a micro-cap player in the Non Banking Financial Company (NBFC) sector, has experienced a notable shift in its valuation parameters, moving from a very expensive to an expensive rating. This change comes amid mixed financial metrics and a challenging market environment, prompting a reassessment of its price attractiveness relative to peers and historical benchmarks.
Read More
Purshottam Investofin Ltd Valuation Shifts Signal Heightened Price Risk
Purshottam Investofin Ltd, a micro-cap player in the Non Banking Financial Company (NBFC) sector, has seen its valuation metrics shift markedly, moving from an expensive to a very expensive rating. Despite a mixed performance track record relative to the Sensex and peers, the company’s price-to-earnings (P/E) ratio now stands at 32.42, signalling a premium that investors should carefully consider amid subdued profitability and sector challenges.
Read More
Purshottam Investofin Ltd Valuation Shifts Signal Heightened Price Risk
Purshottam Investofin Ltd, a micro-cap player in the Non Banking Financial Company (NBFC) sector, has seen a marked shift in its valuation parameters, moving from expensive to very expensive territory. This change, coupled with a recent upgrade to a Strong Sell rating and a significant day gain of 8.02%, warrants a detailed examination of its price attractiveness relative to historical levels and peer benchmarks.
Read More Announcements
Announcement under Regulation 30 (LODR)-Newspaper Publication
31-May-2026 | Source : BSEAs Attached
Submission Of Audited Financial Results Of The Company For The Quarter And Financial Year Ended 31St March 2026.
29-May-2026 | Source : BSEAs attached
Board Meeting Outcome for Outcome Of Board Meeting Held On 29Th May 2026
29-May-2026 | Source : BSEAs attached
Corporate Actions

No Upcoming Board Meetings

No Dividend history available

No Splits history available

No Bonus history available

No Rights history available
Quality key factors
Valuation key factors
Technicals key factors
 Technical Indicator Scale: Bearish, Mildly Bearish, Sideways, Mildly Bullish, Bullish Turned
 Shareholding Snapshot : Mar 2026
Shareholding Compare (%holding)
Non Institution
None
Held by 0 Schemes
Held by 4 FIIs (4.41%)
Mamta Aggarwal (0.0%)
Hallow Securities Private Limited (13.54%)
28.27%
Quarterly Results Snapshot (Standalone) - Mar'26 - QoQ

QoQ Growth in quarter ended Mar 2026 is -73.48% vs 123.37% in Dec 2025
QoQ Growth in quarter ended Mar 2026 is -244.81% vs 218.14% in Dec 2025
Half Yearly Results Snapshot (Standalone) - Sep'25
Growth in half year ended Sep 2025 is -12.05% vs 16.67% in Sep 2024
Growth in half year ended Sep 2025 is -165.45% vs -56.00% in Sep 2024
Nine Monthly Results Snapshot (Standalone) - Dec'25

YoY Growth in nine months ended Dec 2025 is 26.97% vs 17.19% in Dec 2024
YoY Growth in nine months ended Dec 2025 is 212.96% vs -92.52% in Dec 2024
Annual Results Snapshot (Standalone) - Mar'26
YoY Growth in year ended Mar 2026 is -16.08% vs 5.96% in Mar 2025
YoY Growth in year ended Mar 2026 is -383.78% vs -104.42% in Mar 2025
About Purshottam Investofin Ltd


