Dashboard
Weak Long Term Fundamental Strength with an average Return on Capital Employed (ROCE) of 10.51%
- Poor long term growth as Net Sales has grown by an annual rate of 18.86% and Operating profit at 9.81% over the last 5 years
- High Debt Company with a Debt to Equity ratio (avg) at 2.35 times
Flat results in Dec 25
Stock is technically in a Bullish range
With ROE of 15.6, it has a Very Attractive valuation with a 0.6 Price to Book Value
Majority shareholders : Promoters
Market Beating Performance
Total Returns (Price + Dividend) 
Parmeshwari Silk for the last several years.
Risk Adjusted Returns v/s
Returns Beta

News

Parmeshwari Silk Mills Ltd is Rated Hold by MarketsMOJO
Parmeshwari Silk Mills Ltd is rated 'Hold' by MarketsMOJO, with this rating last updated on 18 Feb 2026. While the rating was assigned on that date, the analysis and financial metrics discussed here reflect the company’s current position as of 30 April 2026, providing investors with an up-to-date view of the stock’s fundamentals, valuation, financial trends, and technical outlook.
Read More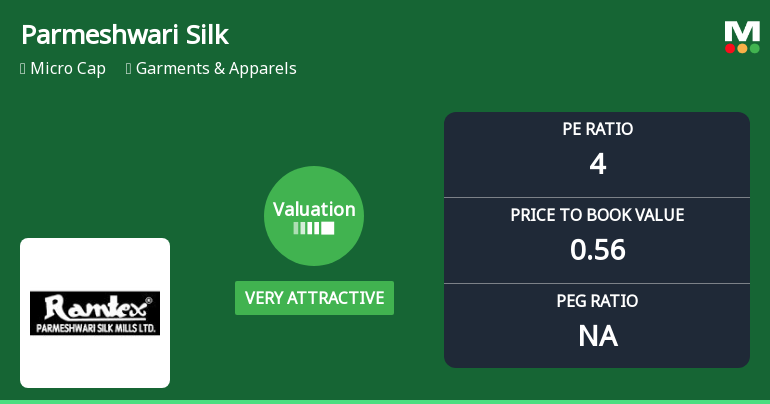
Parmeshwari Silk Mills Ltd Valuation Shifts Signal Strong Price Attractiveness
Parmeshwari Silk Mills Ltd has witnessed a significant shift in its valuation parameters, moving from a risky to a very attractive grade, driven by its exceptionally low price-to-earnings (P/E) and price-to-book value (P/BV) ratios. This micro-cap garment and apparel company has also delivered stellar returns, outperforming the Sensex by a wide margin over the past year, signalling renewed investor interest and potential value opportunity.
Read More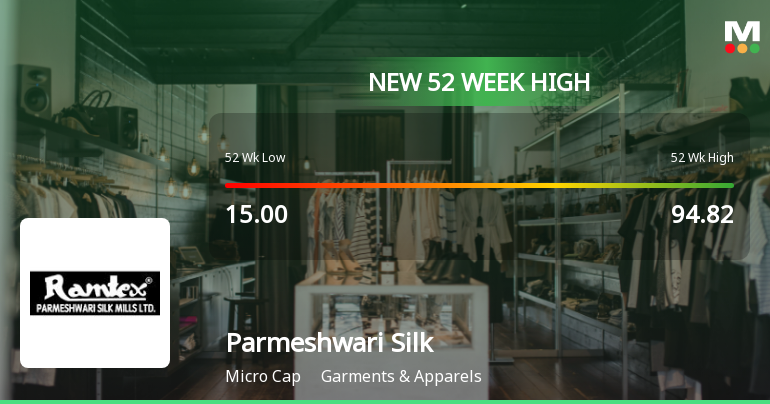
Broad-Based Technical Strength Lifts Parmeshwari Silk Mills Ltd to 52-Week High of Rs 109.75
From a low of Rs 15 just a year ago, Parmeshwari Silk Mills Ltd has surged an extraordinary 509.7% to touch a fresh 52-week and all-time high of Rs 109.75 on 29 Apr 2026, showcasing remarkable price momentum that outpaces the Sensex’s decline of 3.5% over the same period.
Read More Announcements
Announcement under Regulation 30 (LODR)-Newspaper Publication
02-Jun-2026 | Source : BSENewspaper Publication for Audited Standalone & Consolidated Financial Results for the quarter & year ended 31st March 2026
Board Meeting Outcome for Approval Of Audited Standalone And Consolidated Financial Results For Quarter And Year Ended 31St March 2026
29-May-2026 | Source : BSEApproval of Audited Standalone and Consolidated Financial Results for quarter and year ended 31st March 2026
Approval Of Audited Standalone And Consolidated Financial Results For The Quarter And Year Ended 31St March 2026
29-May-2026 | Source : BSEApproval of Audited Standalone and Consolidated Financial Results for the quarter and year ended on 31st March 2026
Corporate Actions

No Upcoming Board Meetings

No Dividend history available

No Splits history available

No Bonus history available

No Rights history available
Quality key factors
Valuation key factors
Technicals key factors
 Technical Indicator Scale: Bearish, Mildly Bearish, Sideways, Mildly Bullish, Bullish Turned
 Shareholding Snapshot : Mar 2026
Shareholding Compare (%holding)
Promoters
None
Held by 0 Schemes
Held by 0 FIIs
Jatinder Pal Singh (23.47%)
Asees Kaur (5.28%)
39.8%
Quarterly Results Snapshot (Consolidated) - Mar'26 - YoY

YoY Growth in quarter ended Mar 2026 is 9.03% vs 15.44% in Mar 2025
YoY Growth in quarter ended Mar 2026 is 26.44% vs 28.40% in Mar 2025
Annual Results Snapshot (Consolidated) - Mar'26
YoY Growth in year ended Mar 2026 is 6.71% vs 14.74% in Mar 2025
YoY Growth in year ended Mar 2026 is 15.26% vs 43.45% in Mar 2025


