Dashboard
Weak Long Term Fundamental Strength with an average Return on Capital Employed (ROCE) of 2.41%
- Poor long term growth as Net Sales has grown by an annual rate of 4.08% and Operating profit at -7.13% over the last 5 years
- Low ability to service debt as the company has a high Debt to EBITDA ratio of 6.45 times
Flat results in Mar 26
Stock is technically in a Bearish range
With ROCE of 4.9, it has a Expensive valuation with a 0.8 Enterprise value to Capital Employed
Consistent Underperformance against the benchmark over the last 3 years
Total Returns (Price + Dividend) 
Latest dividend: 0.5 per share ex-dividend date: Sep-21-2017
Risk Adjusted Returns v/s
Returns Beta

News
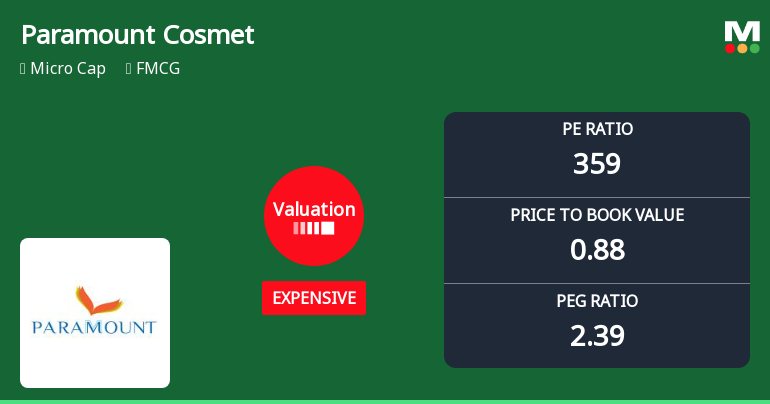
Paramount Cosmetics Valuation Shifts to Expensive Amid Mixed Returns
Paramount Cosmetics (India) Ltd, a micro-cap player in the FMCG sector, has seen a significant shift in its valuation parameters, moving from a previously attractive price range to an expensive territory. Despite a modest day gain of 1.40%, the company’s price-to-earnings (P/E) ratio has surged to an eye-watering 359.17, signalling a sharp re-rating that investors must carefully analyse in the context of its financial performance and peer comparisons.
Read MoreAre Paramount Cosmetics (India) Ltd latest results good or bad?
The latest financial results for Paramount Cosmetics (India) Ltd reveal significant operational challenges. In the quarter ending March 2026, the company reported net sales of ₹2.79 crores, reflecting a year-on-year decline of 53.34% from ₹5.98 crores in the same quarter of the previous year. This marks the lowest revenue level in the available data series. Additionally, the company experienced a net loss of ₹0.05 crores, a stark contrast to a profit of ₹0.03 crores in the preceding quarter. Despite the sharp decline in revenue, the operating margin, excluding other income, rose to 16.49%, up from 4.02% in the previous quarter. However, this increase in margin appears to be a result of the drastic revenue drop rather than genuine operational improvement. The interest coverage ratio was critically low at 0.08 times, indicating that operating profits were insufficient to cover interest payments, which surged...
Read More Announcements
Non Applicability Of Statement Of Deviation & Variation
09-May-2026 | Source : BSESubmission of Non Applicability of Statement of Deviation & Variation
Announcement under Regulation 30 (LODR)-Newspaper Publication
09-May-2026 | Source : BSESubmission of Newspaper Publication.
Announcement under Regulation 30 (LODR)-Change in Management
08-May-2026 | Source : BSEAppointment of Internal Auditor for the FY 2026-27 -Mr . Venkatesh P A Chartered Accountant.
Corporate Actions

No Upcoming Board Meetings

Paramount Cosmetics (India) Ltd has declared 5% dividend, ex-date: 21 Sep 17

No Splits history available

No Bonus history available

No Rights history available
Quality key factors
Valuation key factors
Technicals key factors
 Technical Indicator Scale: Bearish, Mildly Bearish, Sideways, Mildly Bullish, Bullish Turned
 Shareholding Snapshot : Mar 2026
Shareholding Compare (%holding)
Promoters
None
Held by 0 Schemes
Held by 0 FIIs
Hiitesh Topiiwaalla (52.79%)
None
20.07%
Quarterly Results Snapshot (Standalone) - Mar'26 - QoQ

QoQ Growth in quarter ended Mar 2026 is -46.65% vs -39.82% in Dec 2025
QoQ Growth in quarter ended Mar 2026 is -266.67% vs -76.92% in Dec 2025
Half Yearly Results Snapshot (Standalone) - Sep'25

Growth in half year ended Sep 2025 is 51.07% vs -15.15% in Sep 2024
Growth in half year ended Sep 2025 is 133.33% vs -85.00% in Sep 2024
Nine Monthly Results Snapshot (Standalone) - Dec'25
YoY Growth in nine months ended Dec 2025 is 29.08% vs -13.76% in Dec 2024
YoY Growth in nine months ended Dec 2025 is 100.00% vs -78.26% in Dec 2024
Annual Results Snapshot (Standalone) - Mar'26
YoY Growth in year ended Mar 2026 is 4.96% vs -6.56% in Mar 2025
YoY Growth in year ended Mar 2026 is 66.67% vs 50.00% in Mar 2025
About Paramount Cosmetics (India) Ltd


