Dashboard
Weak Long Term Fundamental Strength with an average Return on Equity (ROE) of 2.34%
- Poor long term growth as Net Sales has grown by an annual rate of 6.03% over the last 5 years
- Company's ability to service its debt is weak with a poor EBIT to Interest (avg) ratio of 0.83
The company has declared Negative results for the last 4 consecutive quarters
Stock is technically in a Mildly Bearish range
Risky - Negative Operating Profits
Underperformed the market in the last 1 year
Stock DNA
Diversified consumer products
INR 98 Cr (Micro Cap)
49.00
11
0.00%
-0.14
1.10%
0.22
Total Returns (Price + Dividend) 
Pacific Inds for the last several years.
Risk Adjusted Returns v/s
Returns Beta

News

Pacific Industries Ltd Valuation Shifts Signal Heightened Price Risk
Pacific Industries Ltd, a micro-cap player in the diversified consumer products sector, has seen a marked shift in its valuation parameters, moving from expensive to very expensive territory. Despite a stable share price of ₹143.85, the company’s price-to-earnings (P/E) ratio has surged to 25.17, raising concerns about price attractiveness relative to historical and peer benchmarks.
Read More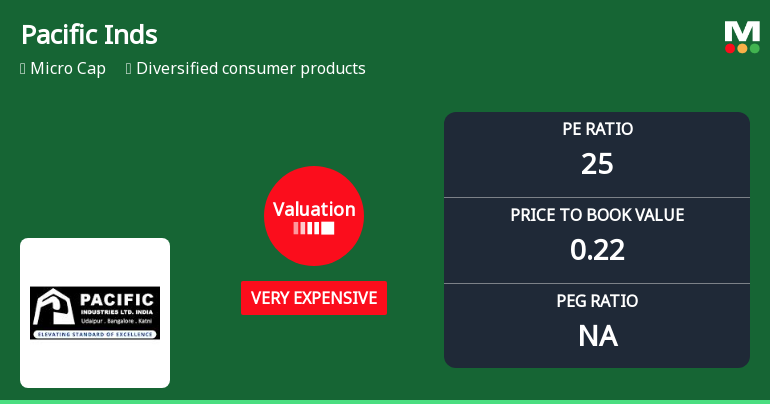
Pacific Industries Ltd Valuation Shifts Signal Heightened Price Risk
Pacific Industries Ltd, a micro-cap player in the diversified consumer products sector, has seen its valuation parameters shift markedly, with its price-to-earnings (P/E) ratio rising to 24.89, signalling a move from expensive to very expensive territory. Despite this, the stock’s recent returns have lagged broader market benchmarks, prompting a reassessment of its investment appeal.
Read More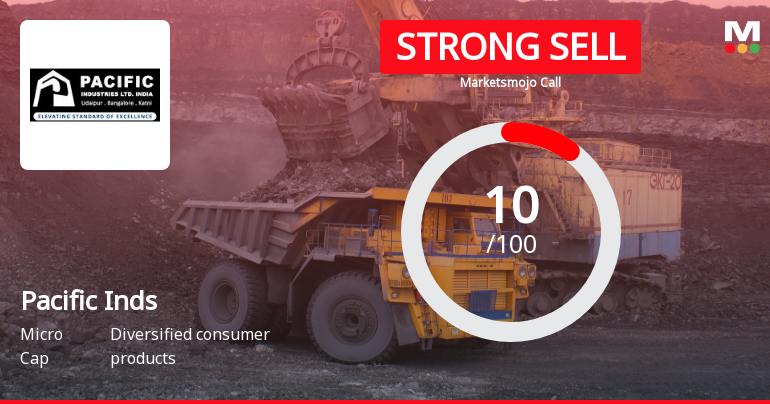
Pacific Industries Ltd is Rated Strong Sell
Pacific Industries Ltd is rated Strong Sell by MarketsMOJO, with this rating last updated on 28 May 2025. However, the analysis and financial metrics discussed here reflect the stock’s current position as of 11 May 2026, providing investors with an up-to-date view of the company’s fundamentals, valuation, financial trends, and technical outlook.
Read More Announcements
Compliances-Reg.24(A)-Annual Secretarial Compliance
29-May-2026 | Source : BSERegulation 24 (A)
Appointment Of Internal Auditor
28-May-2026 | Source : BSEAppointment of Internal Auditor
Results- Financial Results For The Period Ended On 31.03.2026
28-May-2026 | Source : BSEResults 31.03.2026
Corporate Actions

No Upcoming Board Meetings

No Dividend history available

Pacific Industries Ltd has announced 0:0 stock split, ex-date: 18 Jan 08

No Bonus history available

Pacific Industries Ltd has announced 1:1 rights issue, ex-date: 11 Jan 23
Quality key factors
Valuation key factors
Technicals key factors
 Technical Indicator Scale: Bearish, Mildly Bearish, Sideways, Mildly Bullish, Bullish Turned
 Shareholding Snapshot : Mar 2026
Shareholding Compare (%holding)
Promoters
None
Held by 4 Schemes (0.02%)
Held by 0 FIIs (0.0%)
Geeta Devi Agarwal (14.52%)
V And D Investment Private Limited (3.15%)
20.44%
Quarterly Results Snapshot (Consolidated) - Dec'25 - QoQ

QoQ Growth in quarter ended Dec 2025 is -32.58% vs -20.28% in Sep 2025

QoQ Growth in quarter ended Dec 2025 is 12.12% vs -64.52% in Sep 2025
Half Yearly Results Snapshot (Consolidated) - Sep'25
Growth in half year ended Sep 2025 is -26.62% vs 42.15% in Sep 2024
Growth in half year ended Sep 2025 is -68.91% vs -2.66% in Sep 2024
Nine Monthly Results Snapshot (Consolidated) - Dec'25
YoY Growth in nine months ended Dec 2025 is -37.28% vs 41.70% in Dec 2024
YoY Growth in nine months ended Dec 2025 is -69.66% vs -25.42% in Dec 2024
Annual Results Snapshot (Consolidated) - Mar'25
YoY Growth in year ended Mar 2025 is 28.66% vs 1.38% in Mar 2024
YoY Growth in year ended Mar 2025 is -35.61% vs 82.49% in Mar 2024
About Pacific Industries Ltd


