Dashboard
Poor Management Efficiency with a low ROE of 4.14%
- The company has been able to generate a Return on Equity (avg) of 4.14% signifying low profitability per unit of shareholders funds
- NET SALES(9M) At Rs 19.24 cr has Grown at -69.60%
- PBT LESS OI(Q) At Rs -4.44 cr has Fallen at -107.95%
- PAT(Q) At Rs 4.36 cr has Fallen at -90.1%
Stock is technically in a Mildly Bearish range
With ROE of 13.1, it has a Very Expensive valuation with a 0.6 Price to Book Value
Despite the size of the company, domestic mutual funds hold only 0.02% of the company
Stock DNA
Trading & Distributors
INR 577 Cr (Micro Cap)
NA (Loss Making)
93
0.00%
-0.18
13.09%
0.68
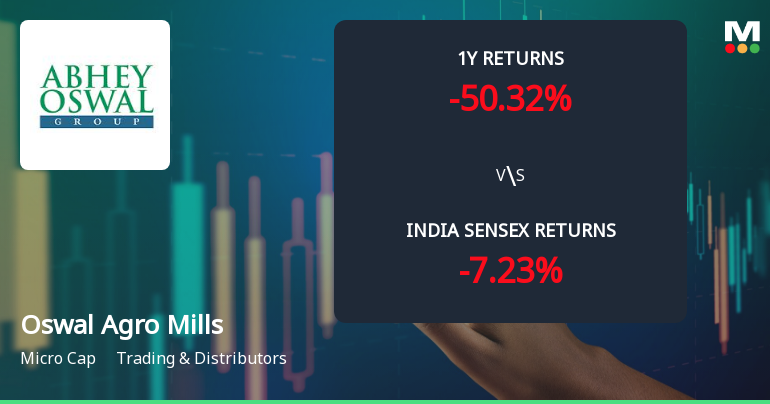
Total Returns (Price + Dividend) 
Oswal Agro Mills for the last several years.
Risk Adjusted Returns v/s
Returns Beta

News
Oswal Agro Mills Ltd Technical Momentum Shifts Amid Bearish Sentiment
Oswal Agro Mills Ltd, a micro-cap player in the Trading & Distributors sector, has experienced a notable shift in its technical parameters, reflecting a complex interplay of bullish and bearish signals. Despite a 4.05% rise in the stock price to ₹46.00 on 21 May 2026, the company’s overall technical outlook remains cautious, with a recent downgrade in its Mojo Grade to Strong Sell from Sell on 26 September 2025.
Read More
Oswal Agro Mills Ltd Faces Intensified Bearish Momentum Amid Technical Deterioration
Oswal Agro Mills Ltd, a micro-cap player in the Trading & Distributors sector, has seen a marked shift in its technical momentum, with key indicators signalling a deepening bearish trend. The stock’s recent price action and technical parameters reveal growing downside risks, underscoring the challenges faced by investors amid a deteriorating market backdrop.
Read More
Oswal Agro Mills Ltd is Rated Strong Sell
Oswal Agro Mills Ltd is rated Strong Sell by MarketsMOJO, with this rating last updated on 12 Feb 2026. However, the analysis and financial metrics discussed here reflect the stock’s current position as of 13 May 2026, providing investors with the latest insights into the company’s performance and outlook.
Read More Announcements
Announcement under Regulation 30 (LODR)-Resignation of Director
11-Jun-2026 | Source : BSEResignation of Mr. Swapneel Vinod Patel (DIN: 09444199) Mr. Gulshan Vohra (DIN: 08658452) and Mrs. Larly Nitin Bahl (DIN: 08495259)
Announcement under Regulation 30 (LODR)-Change in Directorate
11-Jun-2026 | Source : BSEAppointment of Mr.Vimal Bhatnagar (DIN: 11089200) Ms. Prerna Singh (DIN: 10153909) and Mr. Ram Babu Somani (DIN: 09517274)as Additional Non Executive Independent Directors of the Company
Compliances-Reg.24(A)-Annual Secretarial Compliance
29-May-2026 | Source : BSESubmission of Annual Secretarial Compliance Report under Regulation 24A of SEBI (Listing Obligations & Disclosure Requirements) Regulations 2015 for the year ended March 31 2026
Corporate Actions

No Upcoming Board Meetings

No Dividend history available

No Splits history available

No Bonus history available

No Rights history available
Quality key factors
Valuation key factors
Technicals key factors
 Technical Indicator Scale: Bearish, Mildly Bearish, Sideways, Mildly Bullish, Bullish Turned
 Shareholding Snapshot : Mar 2026
Shareholding Compare (%holding)
Promoters
None
Held by 6 Schemes (0.01%)
Held by 2 FIIs (0.03%)
Mrs Aruna Oswal (41.74%)
Alliance Techno Projects Ltd (3.97%)
33.45%
Quarterly Results Snapshot (Consolidated) - Mar'26 - YoY

YoY Growth in quarter ended Mar 2026 is -99.98% vs 15,785.48% in Mar 2025
YoY Growth in quarter ended Mar 2026 is -172.26% vs 5,436.84% in Mar 2025
Half Yearly Results Snapshot (Consolidated) - Sep'25

Growth in half year ended Sep 2025 is 2,274.07% vs 0.00% in Sep 2024
Growth in half year ended Sep 2025 is 229.85% vs 61.94% in Sep 2024
Nine Monthly Results Snapshot (Consolidated) - Dec'25
YoY Growth in nine months ended Dec 2025 is -69.59% vs 4,961.60% in Dec 2024
YoY Growth in nine months ended Dec 2025 is -52.54% vs 1,349.27% in Dec 2024
Annual Results Snapshot (Consolidated) - Mar'26
YoY Growth in year ended Mar 2026 is -88.09% vs 8,550.80% in Mar 2025
YoY Growth in year ended Mar 2026 is -119.52% vs 2,369.15% in Mar 2025
About Oswal Agro Mills Ltd


