Dashboard
Weak Long Term Fundamental Strength with an average Return on Capital Employed (ROCE) of 9.84%
- Poor long term growth as Net Sales has grown by an annual rate of 9.01% and Operating profit at 18.33% over the last 5 years
Negative results in Sep 25
With ROCE of 2.9, it has a Expensive valuation with a 0.9 Enterprise value to Capital Employed
Below par performance in long term as well as near term
Total Returns (Price + Dividend) 
Octavius Plant. for the last several years.
Risk Adjusted Returns v/s
Returns Beta

News
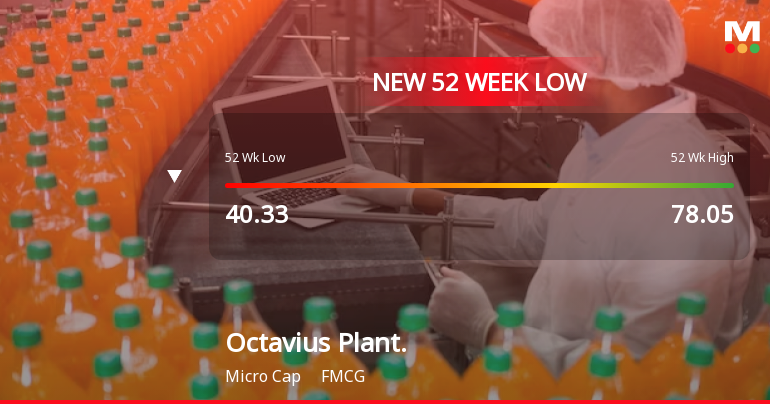
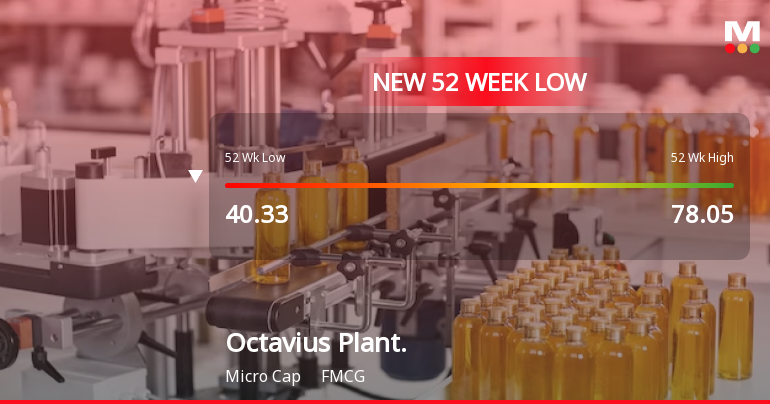
Octavius Plantations Ltd Falls to 52-Week Low of Rs 38.1 as Sell-Off Deepens
A sharp decline of 4.99% today dragged Octavius Plantations Ltd to a fresh 52-week low of Rs 38.1, extending a downward trajectory that has seen the stock lose over 43% in the past year. This fall comes amid a broader market environment where the Sensex itself is hovering near its own 52-week lows, but the scale of underperformance by Octavius Plantations Ltd remains stark.
Read More Announcements
Compliances-Reg.24(A)-Annual Secretarial Compliance
30-May-2026 | Source : BSENon Applicability of Reg 24(A)-Annual Secretarial Compliances
Announcement under Regulation 30 (LODR)-Newspaper Publication
29-May-2026 | Source : BSENewspaper Publication of Audited Financials Results of Financial Year Ended 31.03.2026.
Board Meeting Outcome for Outcome Of Board Meeting Of Company Held On 28/05/2026 As Per Regulation 30Of SEBI (LODR ) Regulation 2015
28-May-2026 | Source : BSEIn Compliance with the provisions of Regulation 30 and 33 of SEBI (LODR ) Regulation 2015 we are pleased to inform you that the Board of Directors of Company at their Meeting held on 28/05/2026 inter alia approved the following 1) audited standalone financial Result for the Financial Year and quarter ended 31.03.2026 and limited Review Report for the audited standalone Financial Results.
Corporate Actions

No Upcoming Board Meetings

No Dividend history available

No Splits history available

No Bonus history available

No Rights history available
Quality key factors
Valuation key factors
Technicals key factors
 Technical Indicator Scale: Bearish, Mildly Bearish, Sideways, Mildly Bullish, Bullish Turned
 Shareholding Snapshot : Mar 2026
Shareholding Compare (%holding)
Non Institution
None
Held by 0 Schemes
Held by 0 FIIs
Shalini Jain (33.8%)
Princi Jain (17.72%)
50.34%
Quarterly Results Snapshot (Standalone) - Mar'26 - QoQ

QoQ Growth in quarter ended Mar 2026 is 163.40% vs 141.33% in Dec 2025

QoQ Growth in quarter ended Mar 2026 is -44.83% vs 190.00% in Dec 2025
Half Yearly Results Snapshot (Standalone) - Sep'25
Growth in half year ended Sep 2025 is -38.41% vs 245.04% in Sep 2024
Growth in half year ended Sep 2025 is 11.43% vs -31.37% in Sep 2024
Nine Monthly Results Snapshot (Standalone) - Dec'25
YoY Growth in nine months ended Dec 2025 is 10.34% vs 79.33% in Dec 2024
YoY Growth in nine months ended Dec 2025 is 6.25% vs -43.86% in Dec 2024
Annual Results Snapshot (Standalone) - Mar'26
YoY Growth in year ended Mar 2026 is 127.03% vs 16.39% in Mar 2025
YoY Growth in year ended Mar 2026 is -3.45% vs -51.12% in Mar 2025
About Octavius Plantations Ltd

Company Coordinates