Dashboard
Weak Long Term Fundamental Strength with an average Return on Capital Employed (ROCE) of 4.57%
- Poor long term growth as Net Sales has grown by an annual rate of 13.61% and Operating profit at 21.70% over the last 5 years
- Low ability to service debt as the company has a high Debt to EBITDA ratio of 8.26 times
Stock is technically in a Bearish range
Below par performance in long term as well as near term
Stock DNA
Garments & Apparels
INR 10 Cr (Micro Cap)
60.00
24
0.00%
1.64
0.52%
1.65
Total Returns (Price + Dividend) 
Nutech Global for the last several years.
Risk Adjusted Returns v/s
Returns Beta

News

Nutech Global Ltd Upgraded to Sell on Improved Valuation and Technicals
Nutech Global Ltd, a micro-cap player in the Garments & Apparels sector, has seen its investment rating upgraded from Strong Sell to Sell as of 18 May 2026. This change reflects a nuanced shift in the company’s technical outlook and valuation metrics, despite ongoing challenges in financial trends and quality parameters. The latest assessment by MarketsMOJO highlights a complex investment case shaped by mixed technical signals, very attractive valuation, and subdued long-term fundamentals.
Read More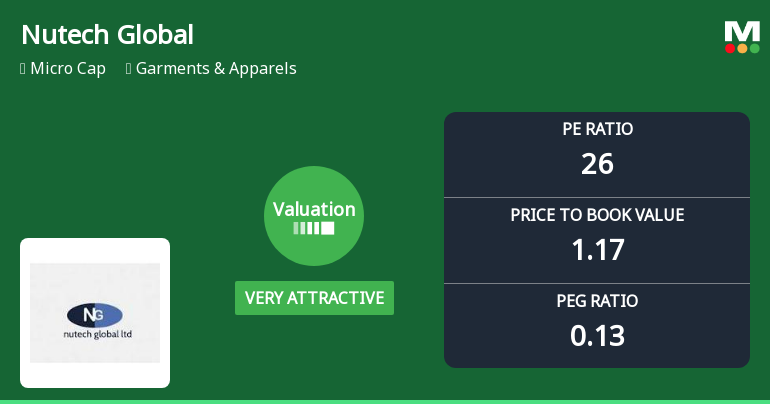
Nutech Global Ltd Valuation Shifts Signal Renewed Price Attractiveness
Nutech Global Ltd, a micro-cap player in the Garments & Apparels sector, has witnessed a notable shift in its valuation parameters, moving from an attractive to a very attractive rating. Despite a recent day decline of 4.99%, the company’s price-to-earnings (P/E) and price-to-book value (P/BV) ratios suggest a compelling investment case relative to its historical averages and peer group, even as its overall Mojo Grade remains a Sell.
Read More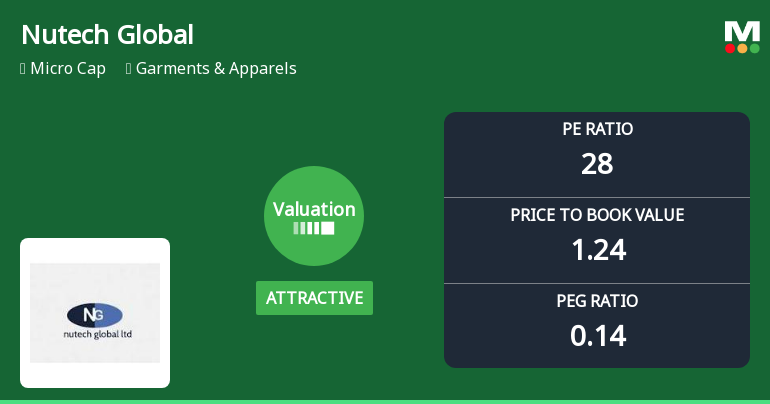
Nutech Global Ltd Valuation Shifts Signal Renewed Price Attractiveness
Nutech Global Ltd, a micro-cap player in the Garments & Apparels sector, has seen its valuation parameters improve from very attractive to attractive, reflecting a notable shift in price attractiveness despite mixed performance against the broader market. The company’s price-to-earnings (P/E) ratio now stands at 27.6, signalling a more balanced valuation compared to its historical and peer averages, while its price-to-book value (P/BV) remains modest at 1.24. This article analyses the implications of these valuation changes and what they mean for investors navigating the current market environment.
Read More Announcements
Intimation Of Non-Applicability Of Annual Secretarial Compliance Report As Per Regulation-24A Of SEBI (Listing Obligations And Disclosures Requirements) Regulations 2015 For The Year Ended 31.03.2026
29-May-2026 | Source : BSENon-Applicability of Annual Secretarial Compliance Report for the year ended 31.03.2026
Announcement under Regulation 30 (LODR)-Newspaper Publication
27-May-2026 | Source : BSENewspaper publications
Financial Results For The Quarter And Financial Year Ended On March 31 2026
26-May-2026 | Source : BSEResults for the Quarter & Year ended March 31 2026
Corporate Actions

No Upcoming Board Meetings

No Dividend history available

No Splits history available

No Bonus history available

No Rights history available
Quality key factors
Valuation key factors
Technicals key factors
 Technical Indicator Scale: Bearish, Mildly Bearish, Sideways, Mildly Bullish, Bullish Turned
 Shareholding Snapshot : Mar 2026
Shareholding Compare (%holding)
Non Institution
None
Held by 0 Schemes
Held by 0 FIIs
Shyam Sunder Mukhija (19.04%)
Ritu Mukhija (6.84%)
56.69%
Quarterly Results Snapshot (Standalone) - Mar'26 - QoQ

QoQ Growth in quarter ended Mar 2026 is -35.77% vs -28.04% in Dec 2025
QoQ Growth in quarter ended Mar 2026 is -91.67% vs -29.41% in Dec 2025
Half Yearly Results Snapshot (Standalone) - Sep'25

Growth in half year ended Sep 2025 is 10.11% vs 1.57% in Sep 2024
Growth in half year ended Sep 2025 is 110.34% vs -141.67% in Sep 2024
Nine Monthly Results Snapshot (Standalone) - Dec'25
YoY Growth in nine months ended Dec 2025 is 22.29% vs -0.68% in Dec 2024
YoY Growth in nine months ended Dec 2025 is 137.50% vs -66.67% in Dec 2024
Annual Results Snapshot (Standalone) - Mar'26
YoY Growth in year ended Mar 2026 is 15.95% vs -3.78% in Mar 2025
YoY Growth in year ended Mar 2026 is 155.17% vs -262.50% in Mar 2025
About Nutech Global Ltd


