Dashboard
Strong Long Term Fundamental Strength with a 32.00% CAGR growth in Net Sales
Healthy long term growth as Net Sales has grown by an annual rate of 32.00%
With a growth in Net Profit of 257%, the company declared Very Positive results in Mar 26
Stock is technically in a Mildly Bullish range
With ROE of 10.4, it has a Attractive valuation with a 1.2 Price to Book Value
Market Beating Performance
Stock DNA
Non Banking Financial Company (NBFC)
INR 4,779 Cr (Small Cap)
12.00
21
0.00%
2.82
7.81%
1.23
Total Returns (Price + Dividend) 
Northern ARC for the last several years.
Risk Adjusted Returns v/s
Returns Beta

News
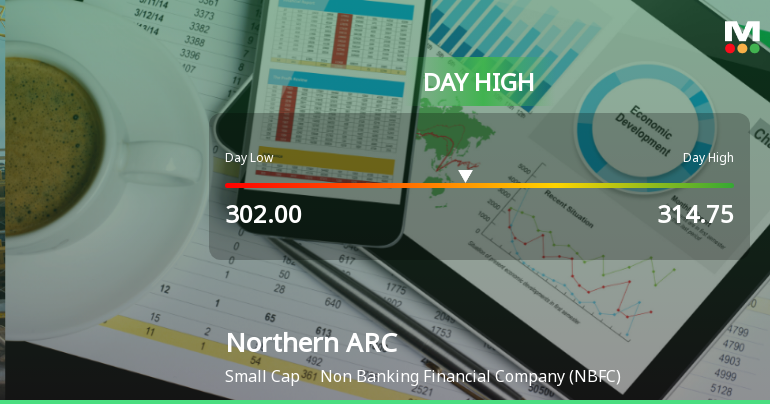
Northern ARC Capital Ltd Surges 7.3% to Day's High of Rs 314.75 — Outperforms Sector by 7.69 Percentage Points
The Sensex declined by 1.31% on 11 May 2026, yet Northern ARC Capital Ltd surged 7.3%, outperforming its sector by 7.69 percentage points. This sharp single-session gain stands out as a stock-specific event amid a broadly weak market environment.
Read More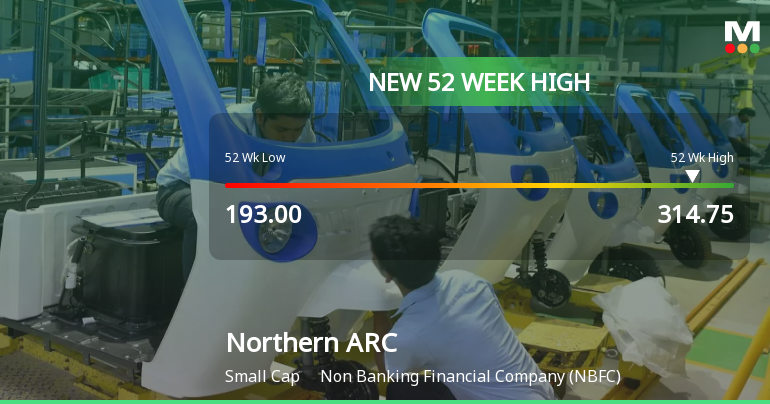
Broad-Based Technical Strength Lifts Northern ARC Capital Ltd to 52-Week High of Rs 314.75
With a decisive surge to Rs 314.75 on 11 Jun 2026, Northern ARC Capital Ltd has reached a new 52-week high, marking a 51.16% gain over the past year. This milestone comes amid a backdrop of broad technical momentum that has propelled the stock well above its key moving averages, even as the broader Sensex trades lower.
Read More
Announcements
Announcement under Regulation 30 (LODR)-Memorandum of Understanding /Agreements
15-Jun-2026 | Source : BSEYES BANK and Northern Arc Capital partner to bridge Indias Credit Gap
Announcement under Regulation 30 (LODR)-Allotment of ESOP / ESPS
02-Jun-2026 | Source : BSEAllotment of 40500 shares under Northern Arc ESOP plan 2016 and ESOP schemes
Announcement under Regulation 30 (LODR)-Analyst / Investor Meet - Intimation
22-May-2026 | Source : BSESchedule of investor meeting to be held on May 27 2026
Corporate Actions

No Upcoming Board Meetings

No Dividend history available

No Splits history available

No Bonus history available

No Rights history available
Quality key factors
Valuation key factors
Technicals key factors
 Technical Indicator Scale: Bearish, Mildly Bearish, Sideways, Mildly Bullish, Bullish Turned
 Shareholding Snapshot : Mar 2026
Shareholding Compare (%holding)
Non Institution
None
Held by 2 Schemes (0.76%)
Held by 26 FIIs (7.51%)
None
Leapfrog Financial Inclusion India (ii) Ltd (16.16%)
24.59%
Quarterly Results Snapshot (Consolidated) - Mar'26 - QoQ

QoQ Growth in quarter ended Mar 2026 is 2.85% vs 14.93% in Dec 2025

QoQ Growth in quarter ended Mar 2026 is 31.50% vs 9.87% in Dec 2025
Half Yearly Results Snapshot (Consolidated) - Sep'25
Growth in half year ended Sep 2025 is 6.01% vs 38.77% in Sep 2024
Growth in half year ended Sep 2025 is -9.63% vs 32.56% in Sep 2024
Nine Monthly Results Snapshot (Consolidated) - Dec'25
YoY Growth in nine months ended Dec 2025 is 12.36% vs 30.71% in Dec 2024
YoY Growth in nine months ended Dec 2025 is 2.53% vs 21.52% in Dec 2024
Annual Results Snapshot (Consolidated) - Mar'26
YoY Growth in year ended Mar 2026 is 14.89% vs 23.89% in Mar 2025
YoY Growth in year ended Mar 2026 is 33.32% vs -1.23% in Mar 2025
About Northern ARC Capital Ltd

Company Coordinates