Dashboard
High Debt company with Weak Long Term Fundamental Strength
- Poor long term growth as Net Sales has grown by an annual rate of 10.19% over the last 5 years
- High Debt Company with a Debt to Equity ratio (avg) at 10.92 times
- The company has been able to generate a Return on Capital Employed (avg) of 6.52% signifying low profitability per unit of total capital (equity and debt)
Flat results in Dec 25
Stock DNA
Trading & Distributors
INR 26 Cr (Micro Cap)
36.00
23
0.00%
3.10
50.98%
9.84
Total Returns (Price + Dividend) 
NMS Global for the last several years.
Risk Adjusted Returns v/s
Returns Beta

News
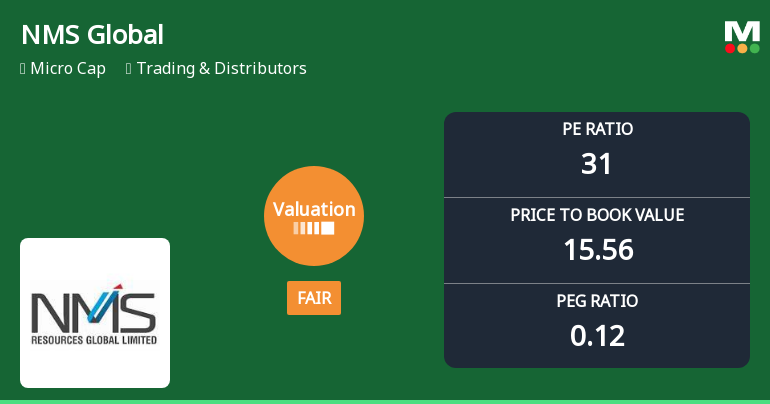
NMS Global Ltd Valuation Shifts Signal Renewed Price Attractiveness Amid Market Volatility
NMS Global Ltd, a micro-cap player in the Trading & Distributors sector, has witnessed a notable shift in its valuation parameters, moving from an expensive to a fair valuation grade. This change comes amid a backdrop of strong year-to-date and one-year returns that significantly outperform the Sensex, despite a recent dip in share price. Investors and analysts are now reassessing the stock’s price attractiveness relative to its historical metrics and peer group, with key valuation multiples and profitability ratios providing fresh insights into its market positioning.
Read More
NMS Global Ltd Valuation Shifts Highlight Price Attractiveness Concerns
NMS Global Ltd, a micro-cap player in the Trading & Distributors sector, has witnessed a marked shift in its valuation parameters, moving from fair to expensive territory. Despite robust returns relative to the Sensex, the company’s elevated price-to-earnings and price-to-book ratios raise questions about its current price attractiveness compared to historical and peer benchmarks.
Read More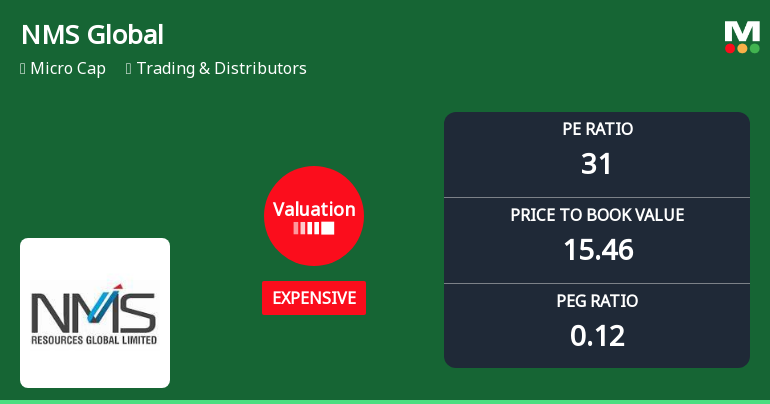
NMS Global Ltd Valuation Shifts Signal Price Attractiveness Concerns Amid Strong Returns
NMS Global Ltd, a micro-cap player in the Trading & Distributors sector, has witnessed a notable shift in its valuation parameters, moving from fair to expensive territory. Despite robust returns over multiple time horizons, the stock’s elevated price-to-earnings (P/E) and price-to-book value (P/BV) ratios relative to historical and peer averages have raised concerns about its price attractiveness. This article analyses the recent valuation changes, compares them with sector peers, and assesses the implications for investors.
Read More Announcements
Disclosure Under Reg 30 Of SEBI LODR Towards BSE Warning Letter Bearing Ref. No. DCS/NC/TS/WL/033/2025-26 Dated December 10 2025 And Various Telephonic Reminders From BSE
12-Jun-2026 | Source : BSEDisclosure
Disclosure Under Regulation 30 Of SEBI (Listing Obligations And Disclosure Requirements) Regulations 2015 - Statement Of Material Change In EGM Notice Held On February 28 2026
11-Jun-2026 | Source : BSEStatement of Material Change in EGM Notice held on February 28 2026
Announcement under Regulation 30 (LODR)-Newspaper Publication
03-Jun-2026 | Source : BSENewspaper publication
Corporate Actions

No Upcoming Board Meetings

No Dividend history available

No Splits history available

No Bonus history available

No Rights history available
Quality key factors
Valuation key factors
Technicals key factors
 Technical Indicator Scale: Bearish, Mildly Bearish, Sideways, Mildly Bullish, Bullish Turned
 Shareholding Snapshot : Mar 2026
Shareholding Compare (%holding)
Non Institution
None
Held by 0 Schemes
Held by 0 FIIs
Ompal Yadav (28.04%)
Kabir Ventures Llp (6.67%)
42.8%
Quarterly Results Snapshot (Consolidated) - Mar'26 - QoQ

QoQ Growth in quarter ended Mar 2026 is 1,917.61% vs -38.68% in Dec 2025
QoQ Growth in quarter ended Mar 2026 is 100.00% vs -78.38% in Dec 2025
Half Yearly Results Snapshot (Consolidated) - Sep'25
Growth in half year ended Sep 2025 is -13.61% vs -21.88% in Sep 2024
Growth in half year ended Sep 2025 is 152.63% vs -48.65% in Sep 2024
Nine Monthly Results Snapshot (Consolidated) - Dec'25
YoY Growth in nine months ended Dec 2025 is -26.70% vs -41.85% in Dec 2024
YoY Growth in nine months ended Dec 2025 is 100.00% vs -70.53% in Dec 2024
Annual Results Snapshot (Consolidated) - Mar'26
YoY Growth in year ended Mar 2026 is 212.74% vs -44.99% in Mar 2025
YoY Growth in year ended Mar 2026 is 75.61% vs 24.24% in Mar 2025
About NMS Global Ltd


