Dashboard
Weak Long Term Fundamental Strength with an average Return on Capital Employed (ROCE) of 3.39%
- Poor long term growth as Operating profit has grown by an annual rate 10.26% of over the last 5 years
- Company's ability to service its debt is weak with a poor EBIT to Interest (avg) ratio of -0.16
Negative results in Dec 25
Stock is technically in a Mildly Bearish range
Reducing Promoter Confidence
Stock DNA
Trading & Distributors
INR 12 Cr (Micro Cap)
28.00
24
0.00%
0.00
7.35%
0.79
Total Returns (Price + Dividend) 
New Light Indust for the last several years.
Risk Adjusted Returns v/s
Returns Beta

News

New Light Industries Ltd Valuation Shifts to Fair Amidst Challenging Market Returns
New Light Industries Ltd, a micro-cap player in the Trading & Distributors sector, has seen a notable shift in its valuation parameters, moving from an expensive to a fair rating. Despite this improvement in price attractiveness, the company continues to face significant headwinds in terms of stock performance and profitability metrics, raising questions about its near-term outlook.
Read More
New Light Industries Ltd Valuation Shifts to Fair Amidst Market Challenges
New Light Industries Ltd has seen a notable shift in its valuation parameters, moving from an expensive to a fair rating, reflecting a recalibration of its price-to-earnings and price-to-book value ratios. Despite this adjustment, the micro-cap trading and distributors company continues to face significant headwinds, with its financial metrics lagging behind sector peers and broader market benchmarks.
Read More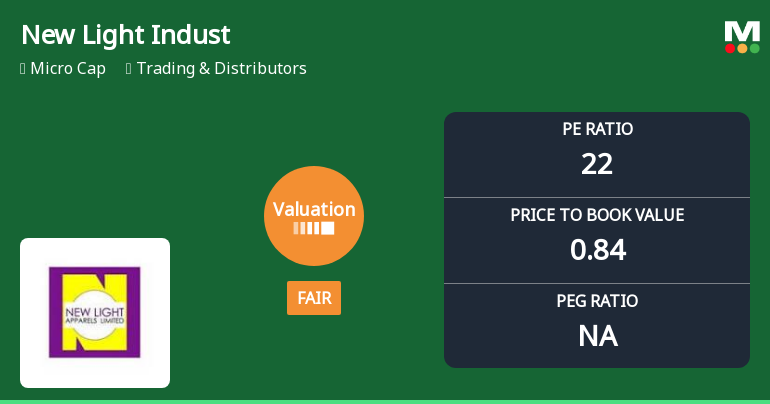
New Light Industries Ltd Valuation Shifts to Fair Amidst Weak Returns
New Light Industries Ltd, a micro-cap player in the Trading & Distributors sector, has recently seen a notable shift in its valuation parameters, moving from an expensive to a fair valuation grade. This article examines the implications of this change, analysing key valuation metrics such as the price-to-earnings (P/E) and price-to-book value (P/BV) ratios in comparison to historical levels and peer averages, while also considering the company’s recent market performance and financial health.
Read More Announcements
Announcement under Regulation 30 (LODR)-Newspaper Publication
01-Jun-2026 | Source : BSENewspaper Publication for the Audited Financial Results of the company for year ended 31th March 2026.
Board Meeting Outcome for Outcome Of Board Meeting Pursuant To Regulation 30 Of SEBI (Listing Obligation & Disclosure Requirements) Regulation 2015
30-May-2026 | Source : BSESubmission of Audited Financial Results for the quarter and year ended 31st March 2026 pursuant to Regulation 33 of SEBI (Listing Obligation & Disclosure Requirements) Regulation 2015.
Submission Of Audited Financial Results For The Quarter And Year Ended 31St March 2026 Pursuant To Regulation 33 Of SEBI (Listing Obligation & Disclosure Requirements) Regulation 2015
30-May-2026 | Source : BSESubmission of Audited Financial Results for the quarter & FY ended on 31st March 2026.
Corporate Actions

No Upcoming Board Meetings

No Dividend history available

New Light Industries Ltd has announced 1:10 stock split, ex-date: 10 Oct 24

No Bonus history available

No Rights history available
Quality key factors
Valuation key factors
Technicals key factors
 Technical Indicator Scale: Bearish, Mildly Bearish, Sideways, Mildly Bullish, Bullish Turned
 Shareholding Snapshot : Mar 2026
Shareholding Compare (%holding)
Non Institution
None
Held by 0 Schemes
Held by 0 FIIs
Meetu Makkad (1.14%)
Manoj Agrawal (huf) (9.01%)
81.91%
Quarterly Results Snapshot (Standalone) - Mar'26 - YoY

YoY Growth in quarter ended Mar 2026 is -63.50% vs -42.69% in Mar 2025
YoY Growth in quarter ended Mar 2026 is -59.09% vs -42.11% in Mar 2025
Half Yearly Results Snapshot (Standalone) - Sep'25
Growth in half year ended Sep 2025 is -27.20% vs 235.52% in Sep 2024
Growth in half year ended Sep 2025 is -13.89% vs 1,000.00% in Sep 2024
Nine Monthly Results Snapshot (Standalone) - Dec'25
YoY Growth in nine months ended Dec 2025 is -57.75% vs 124.80% in Dec 2024
YoY Growth in nine months ended Dec 2025 is -63.74% vs 4,650.00% in Dec 2024
Annual Results Snapshot (Standalone) - Mar'26
YoY Growth in year ended Mar 2026 is -58.90% vs 43.15% in Mar 2025
YoY Growth in year ended Mar 2026 is -63.16% vs 208.11% in Mar 2025
About New Light Industries Ltd


