Total Returns (Price + Dividend) 
Nephrocare Healt for the last several years.
Risk Adjusted Returns v/s
Returns Beta

News
Nephrocare Health Services Ltd Upgraded to Hold on Improved Financial and Quality Metrics
Nephrocare Health Services Ltd has been upgraded to a Hold rating with a Mojo Score of 64.0, reflecting significant improvements in its financial trend and quality parameters. The healthcare services company, operating as a small-cap stock, has demonstrated robust quarterly performance and enhanced institutional interest, despite a recent 5.55% dip in its share price. This article analyses the four key parameters—Quality, Valuation, Financial Trend, and Technicals—that have driven this rating change as of 20 May 2026.
Read More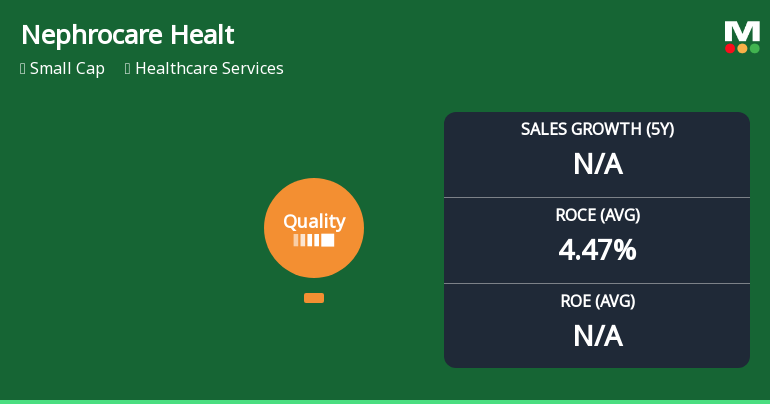
Nephrocare Health Services Ltd Quality Grade Upgrade Signals Improved Business Fundamentals
Nephrocare Health Services Ltd has seen its quality grade upgraded from "Does Not Qualify" to "Good" by MarketsMOJO, reflecting notable improvements in its business fundamentals. Despite a recent 5.55% decline in share price, the healthcare services company demonstrates strengthening operational metrics and financial discipline, positioning it as a noteworthy small-cap in the sector.
Read More Announcements
Announcement under Regulation 30 (LODR)-Analyst / Investor Meet - Intimation
11-Jun-2026 | Source : BSEPursuant to Regulation 30 of the SEBI Listing Regulations we hereby inform you that the Company has scheduled an Investor Conference Call as per the disclosure enclosed herewith.
Announcement under Regulation 30 (LODR)-Memorandum of Understanding /Agreements
10-Jun-2026 | Source : BSEPursuant to Reg 30 of SEBI LODR Regulations 2015 we hereby inform that Nephrocare Health Services Philippines Inc. overseas step-down wholly owned subsidiary of the company has acquired a Dialysis centre and has executed Asset Transfer Agreement as per the disclosure annexed herewith.
Announcement under Regulation 30 (LODR)-Memorandum of Understanding /Agreements
04-Jun-2026 | Source : BSEPursuant to Reg 30 of SEBI LODR Regulations 2015 we hereby inform that Nephrocare Health Services Philippines Inc. overseas step-down wholly owned subsidiary of the company has acquired a Dialysis centre and has executed Asset Transfer Agreement as per the disclosure annexed herewith.
Corporate Actions

No Upcoming Board Meetings

No Dividend history available

No Splits history available

No Bonus history available

No Rights history available
Quality key factors
Valuation key factors
Technicals key factors
 Technical Indicator Scale: Bearish, Mildly Bearish, Sideways, Mildly Bullish, Bullish Turned
 Shareholding Snapshot : Mar 2026
Shareholding Compare (%holding)
Promoters
None
Held by 7 Schemes (3.17%)
Held by 20 FIIs (9.94%)
Edoras Investment Holdings Pte Ltd (28.3%)
Investcorp India Investments Holding Limited (6.29%)
5.08%
Quarterly Results Snapshot (Standalone) - Mar'26 - QoQ

QoQ Growth in quarter ended Mar 2026 is 2.28% vs 3.04% in Dec 2025
QoQ Growth in quarter ended Mar 2026 is 28.88% vs 126.07% in Dec 2025
Annual Results Snapshot (Standalone) - Mar'26
Not Applicable: The company has declared_date for only one period
Not Applicable: The company has declared_date for only one period


