Dashboard
Low ability to service debt as the company has a high Debt to EBITDA ratio of 4.34 times
- Low ability to service debt as the company has a high Debt to EBITDA ratio of 4.34 times
- The company has been able to generate a Return on Equity (avg) of 6.86% signifying low profitability per unit of shareholders funds
Poor long term growth as Operating profit has grown by an annual rate 13.82% of over the last 5 years
The company has declared Negative results for the last 3 consecutive quarters
Stock is technically in a Bullish range
With ROCE of 5, it has a Very Expensive valuation with a 2.7 Enterprise value to Capital Employed
Stock DNA
Specialty Chemicals
INR 5,206 Cr (Small Cap)
186.00
42
0.05%
1.23
4.41%
6.53
Total Returns (Price + Dividend) 
Latest dividend: 1 per share ex-dividend date: Sep-19-2025
Risk Adjusted Returns v/s
Returns Beta

News
Neogen Chemicals Ltd Technical Momentum Shifts Signal Bullish Outlook Amid Market Volatility
Neogen Chemicals Ltd has experienced a notable shift in price momentum, with technical indicators signalling a transition from mildly bullish to bullish trends. The stock’s recent surge, reflected in a 7.63% day change and a closing price of ₹1,701.20, underscores renewed investor interest amid mixed signals from various technical tools.
Read More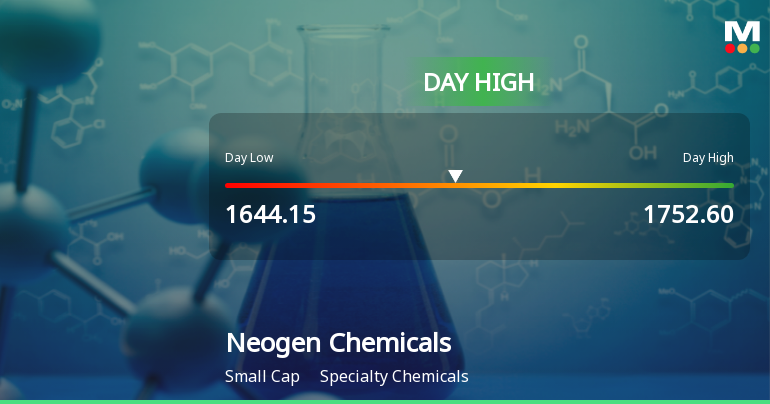
Neogen Chemicals Ltd Surges 7.34% to Day's High of Rs 1752.6 — Outperforms Sector by 7.43 Percentage Points
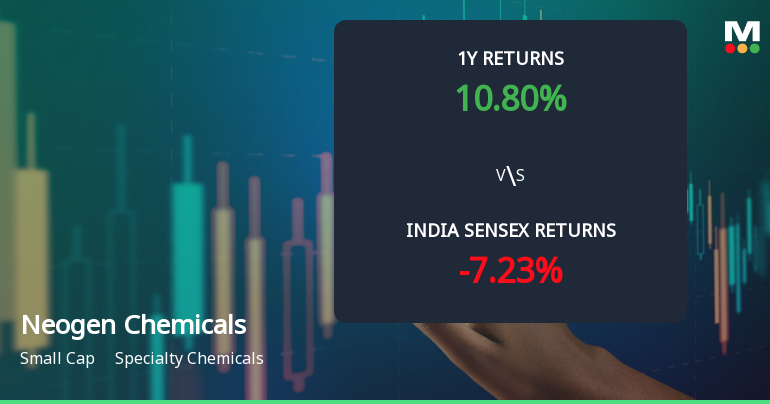
While the Sensex slipped 0.37% on 20 May 2026, Neogen Chemicals Ltd surged 7.34%, marking a standout session in the Specialty Chemicals sector. This 7.43-percentage-point outperformance signals a distinctly stock-specific event amid a broadly subdued market environment.
Read More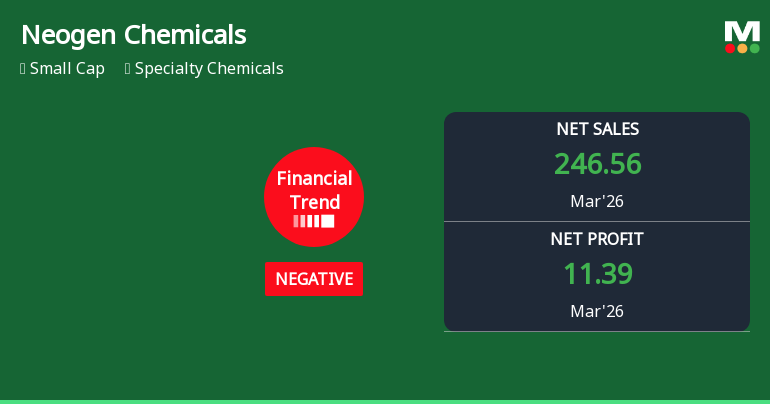
Neogen Chemicals Ltd Reports Mixed Quarterly Results Amid Margin Pressures
Neogen Chemicals Ltd, a specialty chemicals small-cap, has reported its quarterly results for March 2026, revealing a complex financial picture marked by record sales and profit growth alongside deteriorating key financial ratios and a shift from flat to negative financial trend. Despite strong operational metrics, the company faces challenges in profitability sustainability and balance sheet health, prompting a revised Hold rating from MarketsMOJO.
Read More Announcements
Announcement under Regulation 30 (LODR)-Analyst / Investor Meet - Intimation
12-Jun-2026 | Source : BSEIntimation of Analyst / Investor Meet to be held on June 23 2026.
Disclosures under Reg. 29(2) of SEBI (SAST) Regulations 2011
05-Jun-2026 | Source : BSEThe Exchange has received the disclosure under Regulation 29(2) of SEBI (Substantial Acquisition of Shares & Takeovers) Regulations 2011 for Axis Mutual Fund
Disclosures under Reg. 29(2) of SEBI (SAST) Regulations 2011
05-Jun-2026 | Source : BSEThe Exchange has received the disclosure under Regulation 29(2) of SEBI (Substantial Acquisition of Shares & Takeovers) Regulations 2011 for Axis Mutual Fund
Corporate Actions

No Upcoming Board Meetings

Neogen Chemicals Ltd has declared 10% dividend, ex-date: 19 Sep 25

No Splits history available

No Bonus history available

No Rights history available
Quality key factors
Valuation key factors
Technicals key factors
 Technical Indicator Scale: Bearish, Mildly Bearish, Sideways, Mildly Bullish, Bullish Turned
 Shareholding Snapshot : Apr 2026
Shareholding Compare (%holding)
Promoters
22.999
Held by 12 Schemes (18.29%)
Held by 37 FIIs (4.29%)
Haridas Kanani Family Trust (beena Haridas Kanani And Harin Haridas Kanani) (20.0%)
Sbi Contra Fund (8.85%)
14.67%
Quarterly Results Snapshot (Consolidated) - Mar'26 - QoQ

QoQ Growth in quarter ended Mar 2026 is 12.06% vs 5.44% in Dec 2025
QoQ Growth in quarter ended Mar 2026 is 208.67% vs 9.50% in Dec 2025
Half Yearly Results Snapshot (Consolidated) - Sep'25

Growth in half year ended Sep 2025 is 5.91% vs 14.31% in Sep 2024
Growth in half year ended Sep 2025 is -39.18% vs 26.83% in Sep 2024
Nine Monthly Results Snapshot (Consolidated) - Dec'25
YoY Growth in nine months ended Dec 2025 is 7.08% vs 17.05% in Dec 2024
YoY Growth in nine months ended Dec 2025 is -46.58% vs 73.09% in Dec 2024
Annual Results Snapshot (Consolidated) - Mar'26
YoY Growth in year ended Mar 2026 is 10.85% vs 12.58% in Mar 2025
YoY Growth in year ended Mar 2026 is -17.46% vs -2.30% in Mar 2025
About Neogen Chemicals Ltd

Company Coordinates