Dashboard
Weak Long Term Fundamental Strength with a 7.28% CAGR growth in Net Sales over the last 5 years
- Company's ability to service its debt is weak with a poor EBIT to Interest (avg) ratio of 1.55
- The company has been able to generate a Return on Equity (avg) of 2.45% signifying low profitability per unit of shareholders funds
Flat results in Mar 26
Stock is technically in a Mildly Bearish range
With ROE of 2.5, it has a Expensive valuation with a 0.2 Price to Book Value
Underperformed the market in the last 1 year
Stock DNA
Non Banking Financial Company (NBFC)
INR 13 Cr (Micro Cap)
9.00
24
0.00%
0.10
2.31%
0.22
Total Returns (Price + Dividend) 
Neil Industries for the last several years.
Risk Adjusted Returns v/s
Returns Beta

News
When is the next results date for Neil Industries Ltd?
The next results date for Neil Industries Ltd is scheduled for 25 May 2026....
Read More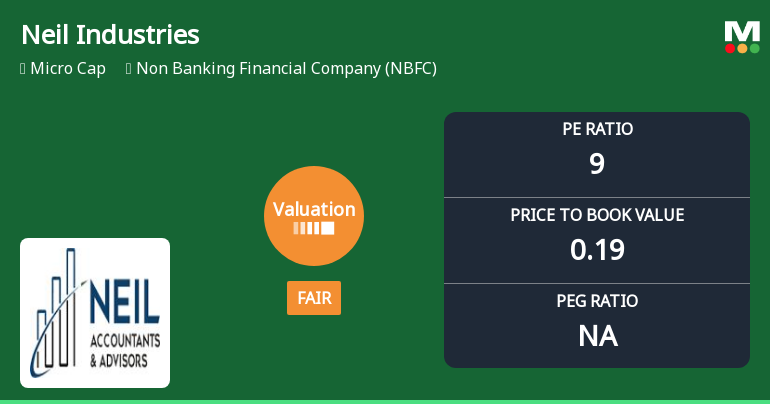
Neil Industries Ltd Valuation Shifts to Fair Amidst Prolonged Underperformance
Neil Industries Ltd, a micro-cap player in the Non Banking Financial Company (NBFC) sector, has witnessed a notable shift in its valuation parameters, moving from an expensive to a fair valuation grade. This transition comes amid a challenging market environment and deteriorating returns relative to benchmarks, raising questions about the stock’s price attractiveness and future prospects.
Read More Announcements
Compliances-Reg.24(A)-Annual Secretarial Compliance
28-May-2026 | Source : BSEAnnual Secretarial Compliance Report for the year ended March 31 2026.
Announcement under Regulation 30 (LODR)-Newspaper Publication
27-May-2026 | Source : BSENewspaper clipping of the Advertisement extract pertaining to the Disclosure of Audited Financial Results of the Company for the quarter and year ended March 31 2026.
Board Meeting Outcome for Outcome Of The Board Meeting Held On May 25 2026.
25-May-2026 | Source : BSEOutcome of the Board Meeting held on May 25 2026.
Corporate Actions

No Upcoming Board Meetings

No Dividend history available

No Splits history available

No Bonus history available

No Rights history available
Quality key factors
Valuation key factors
Technicals key factors
 Technical Indicator Scale: Bearish, Mildly Bearish, Sideways, Mildly Bullish, Bullish Turned
 Shareholding Snapshot : Mar 2026
Shareholding Compare (%holding)
Non Institution
None
Held by 0 Schemes
Held by 0 FIIs
Arvind Kr Mittal . (0.94%)
Surendra Kumar Gupta (5.18%)
80.66%
Quarterly Results Snapshot (Standalone) - Mar'26 - QoQ

QoQ Growth in quarter ended Mar 2026 is -1.00% vs 0.00% in Dec 2025

QoQ Growth in quarter ended Mar 2026 is -8.57% vs -28.57% in Dec 2025
Half Yearly Results Snapshot (Standalone) - Sep'25
Growth in half year ended Sep 2025 is 36.11% vs -10.56% in Sep 2024
Growth in half year ended Sep 2025 is 26.15% vs -37.50% in Sep 2024
Nine Monthly Results Snapshot (Standalone) - Dec'25
YoY Growth in nine months ended Dec 2025 is 33.94% vs -8.68% in Dec 2024
YoY Growth in nine months ended Dec 2025 is 10.38% vs -31.17% in Dec 2024
Annual Results Snapshot (Standalone) - Mar'26
YoY Growth in year ended Mar 2026 is 28.66% vs -2.85% in Mar 2025
YoY Growth in year ended Mar 2026 is 24.37% vs -52.59% in Mar 2025
About Neil Industries Ltd


