Dashboard
Weak Long Term Fundamental Strength with an average Return on Capital Employed (ROCE) of 3.81%
- Poor long term growth as Net Sales has grown by an annual rate of 30.84% and Operating profit at 8.01% over the last 5 years
- High Debt Company with a Debt to Equity ratio (avg) at 0.69 times
Flat results in Dec 25
Stock is technically in a Mildly Bearish range
With ROE of 7.7, it has a Expensive valuation with a 2.1 Price to Book Value
Below par performance in long term as well as near term
Total Returns (Price + Dividend) 
Neelkanth for the last several years.
Risk Adjusted Returns v/s
Returns Beta

News
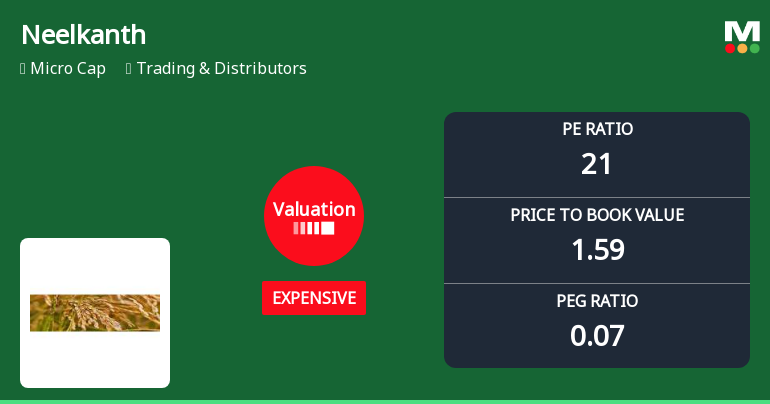
Neelkanth Ltd Valuation Shifts Signal Price Attractiveness Concerns
Neelkanth Ltd, a micro-cap player in the Trading & Distributors sector, has seen its valuation parameters shift notably, raising questions about its price attractiveness. The company’s price-to-earnings (P/E) ratio has moved into an expensive territory at 20.66, while its price-to-book value (P/BV) stands at 1.59, signalling a premium compared to historical averages and peer benchmarks. This article analyses these valuation changes in detail, placing them in the context of Neelkanth’s financial performance, sector dynamics, and relative market positioning.
Read More
Neelkanth Ltd Downgraded to Strong Sell Amid Technical Weakness and Flat Financials
Neelkanth Ltd, a micro-cap player in the Trading & Distributors sector, has been downgraded from a Sell to a Strong Sell rating as of 13 April 2026. This revision reflects deteriorating technical indicators, stagnant financial performance, and subdued long-term fundamentals, signalling increased caution for investors amid a challenging market environment.
Read More
Neelkanth Ltd Downgraded to Strong Sell Amid Technical Weakness and Flat Financials
Neelkanth Ltd, a micro-cap player in the Trading & Distributors sector, has been downgraded from a Sell to a Strong Sell rating as of 2 April 2026. This revision reflects a deterioration in its technical indicators, stagnant financial performance, and weak fundamental metrics, signalling heightened risks for investors amid challenging market conditions.
Read More Announcements
Announcement under Regulation 30 (LODR)-Newspaper Publication
30-May-2026 | Source : BSEAs per attachment.
Results-Financial Results For The Quarter & Year Ended 31.03.2026
29-May-2026 | Source : BSEAs per attachment
Non-Applicability Of Disclosure Of Related Party Transactions For The Half Year Ended March 31 2026
29-May-2026 | Source : BSEAs per attachment
Corporate Actions

No Upcoming Board Meetings

No Dividend history available

No Splits history available

No Bonus history available

No Rights history available
Quality key factors
Valuation key factors
Technicals key factors
 Technical Indicator Scale: Bearish, Mildly Bearish, Sideways, Mildly Bullish, Bullish Turned
 Shareholding Snapshot : Mar 2026
Shareholding Compare (%holding)
Promoters
None
Held by 3 Schemes (0.02%)
Held by 0 FIIs
Rashmi C Bhimjyani (55.82%)
Gulshan Rai (5.31%)
25.93%
Quarterly Results Snapshot (Standalone) - Mar'26 - YoY

YoY Growth in quarter ended Mar 2026 is -100.00% vs 148.54% in Mar 2025
YoY Growth in quarter ended Mar 2026 is -173.91% vs 109.09% in Mar 2025
Annual Results Snapshot (Standalone) - Mar'26
YoY Growth in year ended Mar 2026 is -33.60% vs -13.64% in Mar 2025

YoY Growth in year ended Mar 2026 is 2,400.00% vs -96.67% in Mar 2025


