Dashboard
With a Operating Losses, the company has a Weak Long Term Fundamental Strength
- Company's ability to service its debt is weak with a poor EBIT to Interest (avg) ratio of -0.96
- The company has reported losses. Due to this company has reported negative ROCE
Flat results in Dec 25
Risky - Negative EBITDA
Stock DNA
Iron & Steel Products
INR 35 Cr (Micro Cap)
NA (Loss Making)
26
0.00%
-0.22
0.14%
0.96
Total Returns (Price + Dividend) 
Natl. Gen. Inds. for the last several years.
Risk Adjusted Returns v/s
Returns Beta

News

National General Industries Ltd is Rated Sell
National General Industries Ltd is rated 'Sell' by MarketsMOJO, with this rating last updated on 06 April 2026. However, the analysis and financial metrics discussed here reflect the stock's current position as of 23 April 2026, providing investors with the latest insights into the company’s performance and outlook.
Read More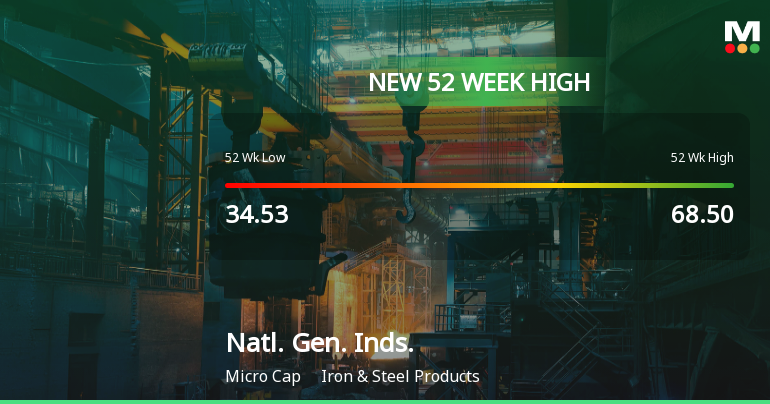
Broad-Based Technical Strength Lifts National General Industries Ltd to 52-Week High of Rs 72.92
Surging past its previous peak, National General Industries Ltd touched a fresh 52-week high of Rs 72.92 on 20 Apr 2026, marking a remarkable rally of 111.1% from its 52-week low of Rs 34.53. This milestone comes amid a sustained five-day winning streak, with the stock gaining 25.05% in that period, underscoring robust price momentum and technical alignment.
Read More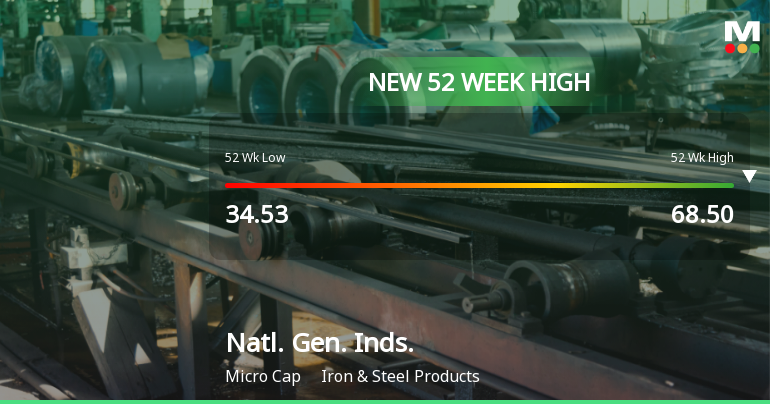
Broad-Based Technical Strength Lifts National General Industries Ltd to 52-Week High of Rs 69.45
With a decisive surge to Rs 69.45 on 17 Apr 2026, National General Industries Ltd has reached a fresh 52-week high, marking a significant milestone in its price momentum. This rally is underpinned by a confluence of technical indicators signalling robust upward momentum across weekly and monthly timeframes.
Read More Announcements
Disclosures under Reg. 10(6) of SEBI (SAST) Regulations 2011
10-Jun-2026 | Source : BSEThe Exchange has received the disclosure under Regulation 10(6) of SEBI (Substantial Acquisition of Shares & Takeovers) Regulations 2011 for Pawan Kumar Modi
Disclosures under Reg. 29(1) of SEBI (SAST) Regulations 2011
09-Jun-2026 | Source : BSEThe Exchange has received the disclosure under Regulation 29(1) of SEBI (Substantial Acquisition of Shares & Takeovers) Regulations 2011 for Pawan Kumar Modi
Disclosures under Reg. 29(2) of SEBI (SAST) Regulations 2011
09-Jun-2026 | Source : BSEThe Exchange has received the disclosure under Regulation 29(2) of SEBI (Substantial Acquisition of Shares & Takeovers) Regulations 2011 for Ashok Modi
Corporate Actions

No Upcoming Board Meetings

No Dividend history available

No Splits history available

No Bonus history available

No Rights history available
Quality key factors
Valuation key factors
Technicals key factors
 Technical Indicator Scale: Bearish, Mildly Bearish, Sideways, Mildly Bullish, Bullish Turned
 Shareholding Snapshot : Mar 2026
Shareholding Compare (%holding)
Promoters
None
Held by 0 Schemes
Held by 0 FIIs
Ashok Kumar Modi (22.3%)
Badrinath Industries Limited (6.02%)
14.44%
Quarterly Results Snapshot (Standalone) - Dec'25 - QoQ

QoQ Growth in quarter ended Dec 2025 is 29.38% vs 30.25% in Sep 2025

QoQ Growth in quarter ended Dec 2025 is 171.43% vs 16.00% in Sep 2025
Half Yearly Results Snapshot (Standalone) - Sep'25
Growth in half year ended Sep 2025 is -24.80% vs -17.33% in Sep 2024
Growth in half year ended Sep 2025 is -206.98% vs 30.30% in Sep 2024
Nine Monthly Results Snapshot (Standalone) - Dec'25
YoY Growth in nine months ended Dec 2025 is -14.89% vs -16.68% in Dec 2024
YoY Growth in nine months ended Dec 2025 is -149.21% vs -73.31% in Dec 2024
Annual Results Snapshot (Standalone) - Mar'25
YoY Growth in year ended Mar 2025 is -19.20% vs -4.69% in Mar 2024
YoY Growth in year ended Mar 2025 is -68.67% vs 1,263.64% in Mar 2024
About National General Industries Ltd


