Dashboard
Weak Long Term Fundamental Strength with an average Return on Equity (ROE) of 0.62%
- Poor long term growth as Net Sales has grown by an annual rate of 6.16% and Operating profit at 1.32%
Negative results in Dec 25
Stock is technically in a Mildly Bearish range
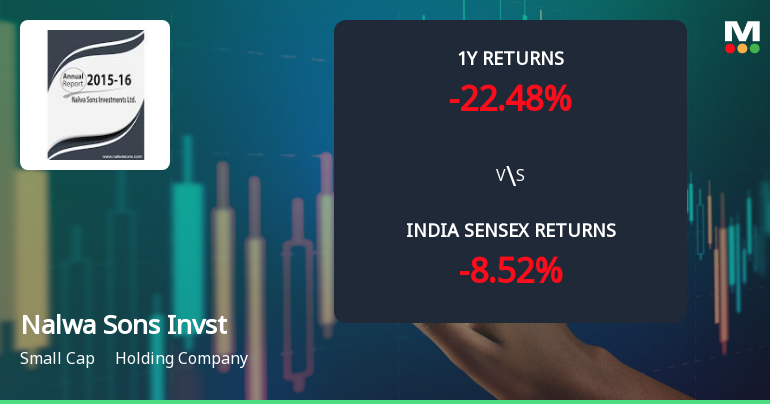
Underperformed the market in the last 1 year
Stock DNA
Holding Company
INR 2,931 Cr (Small Cap)
53.00
21
0.00%
0.00
0.15%
0.19
Total Returns (Price + Dividend) 
Nalwa Sons Invst for the last several years.
Risk Adjusted Returns v/s
Returns Beta

News
Nalwa Sons Investments Ltd Faces Bearish Momentum Amid Technical Downgrade
Nalwa Sons Investments Ltd, a holding company with a small-cap market capitalisation, has experienced a notable shift in its technical momentum, moving from a mildly bearish stance to a more pronounced bearish trend. This transition is underscored by a combination of weakening moving averages, bearish Bollinger Bands, and mixed signals from momentum indicators such as MACD and KST, signalling increased caution for investors amid a challenging market environment.
Read More
Nalwa Sons Investments Ltd is Rated Strong Sell
Nalwa Sons Investments Ltd is rated Strong Sell by MarketsMOJO, with this rating last updated on 29 Dec 2025. However, the analysis and financial metrics discussed here reflect the stock’s current position as of 12 May 2026, providing investors with the latest insights into the company’s performance and outlook.
Read More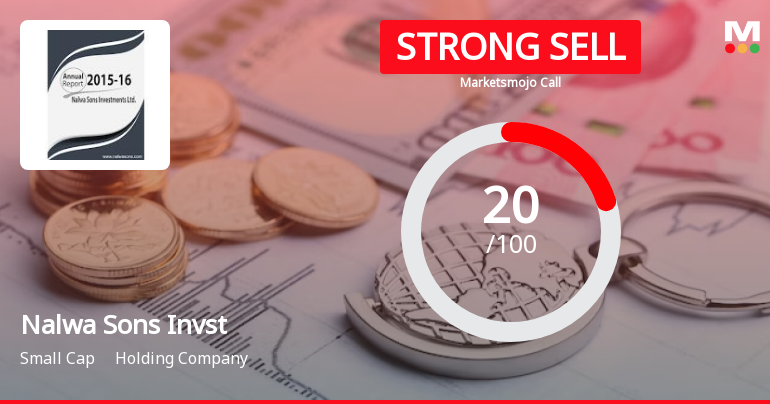
Nalwa Sons Investments Ltd is Rated Strong Sell
Nalwa Sons Investments Ltd is rated Strong Sell by MarketsMOJO. This rating was last updated on 29 December 2025. However, the analysis and financial metrics presented here reflect the stock's current position as of 20 April 2026, providing investors with the latest insights into the company’s performance and outlook.
Read More Announcements
Compliances-Reg.24(A)-Annual Secretarial Compliance
29-May-2026 | Source : BSESubmission of Annual Secretarial Compliance Report for the financial year ended march 31 2026 under regulation 24A(2) of the Securities and Exchange Board of India(Listing Obligations and Disclosure Requirements) Regulations 2015 as amended
Board Meeting Outcome for Outcome Of Board Meeting Under Regulations 30 And 33 Of SEBI (Listing Obligations And Disclosure Requirements) Regulations 2015 (SEBI Listing Regulations)
28-May-2026 | Source : BSEOutcome of Board Meeting under Regulations 30 and 33 of SEBI (Listing Obligations and Disclosure Requirements) Regulations 2015 (SEBI Listing Regulations)
Outcome Of Board Meeting Under Regulations 30 And 33 Of SEBI (Listing Obligations And Disclosure Requirements) Regulations 2015 (SEBI Listing Regulations)
28-May-2026 | Source : BSEOutcome of Board Meeting under regulations 30 and 33 of SEBI(listing Obligations and Disclosure Requirements) Regulations 2015
Corporate Actions

No Upcoming Board Meetings

No Dividend history available

No Splits history available

No Bonus history available

No Rights history available
Quality key factors
Valuation key factors
Technicals key factors
 Technical Indicator Scale: Bearish, Mildly Bearish, Sideways, Mildly Bullish, Bullish Turned
 Shareholding Snapshot : Mar 2026
Shareholding Compare (%holding)
Promoters
None
Held by 15 Schemes (0.03%)
Held by 31 FIIs (6.19%)
Siddeshwari Tradex Pvt Ltd (13.51%)
Vistra Itcl (india) Limited (9.46%)
17.43%
Quarterly Results Snapshot (Consolidated) - Dec'25 - QoQ

QoQ Growth in quarter ended Dec 2025 is -51.72% vs -33.32% in Sep 2025
QoQ Growth in quarter ended Dec 2025 is -52.35% vs -39.05% in Sep 2025
Half Yearly Results Snapshot (Consolidated) - Sep'25
Growth in half year ended Sep 2025 is -37.80% vs 12.43% in Sep 2024
Growth in half year ended Sep 2025 is -35.29% vs 14.02% in Sep 2024
Nine Monthly Results Snapshot (Consolidated) - Dec'25
YoY Growth in nine months ended Dec 2025 is -34.69% vs 45.77% in Dec 2024
YoY Growth in nine months ended Dec 2025 is -32.23% vs 32.45% in Dec 2024
Annual Results Snapshot (Consolidated) - Mar'25

YoY Growth in year ended Mar 2025 is 41.65% vs -33.78% in Mar 2024
YoY Growth in year ended Mar 2025 is -16.99% vs -38.11% in Mar 2024
About Nalwa Sons Investments Ltd


