Dashboard
Low ability to service debt as the company has a high Debt to EBITDA ratio of 3.73 times
- Low ability to service debt as the company has a high Debt to EBITDA ratio of 3.73 times
- The company has been able to generate a Return on Capital Employed (avg) of 12.21% signifying low profitability per unit of total capital (equity and debt)
Healthy long term growth as Net Sales has grown by an annual rate of 30.16%
The company has declared Positive results for the last 4 consecutive quarters
Stock is technically in a Bullish range
With ROCE of 11.7, it has a Fair valuation with a 2.1 Enterprise value to Capital Employed
Total Returns (Price + Dividend) 
Megastar Foods for the last several years.
Risk Adjusted Returns v/s
Returns Beta

News
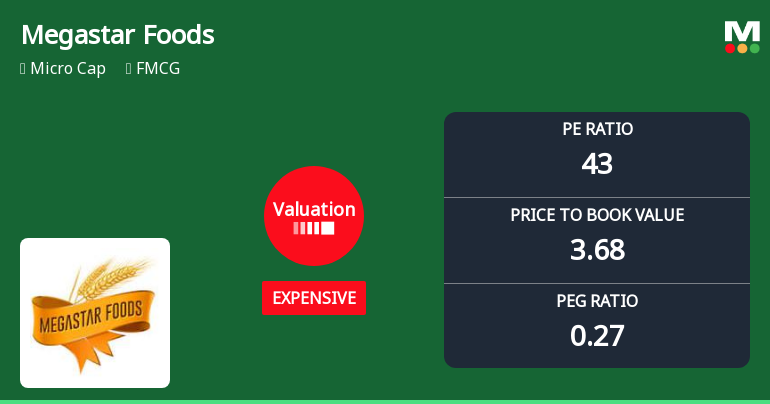
Megastar Foods Ltd Valuation Shifts Signal Changing Market Sentiment
Megastar Foods Ltd, a micro-cap player in the FMCG sector, has witnessed a notable shift in its valuation parameters, moving from fair to expensive territory. Despite this, the company’s stock has delivered robust returns significantly outperforming the Sensex over multiple time horizons, prompting a reassessment of its investment appeal and valuation attractiveness.
Read More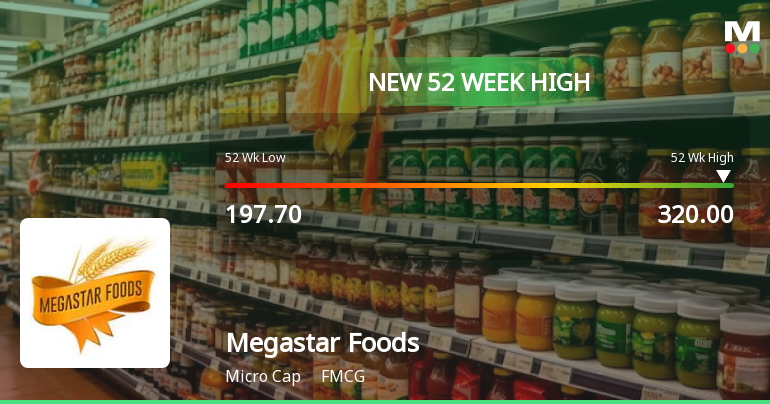
Broad-Based Technical Strength Lifts Megastar Foods Ltd to 52-Week High of Rs 320
With a decisive surge to Rs 320 on 19 May 2026, Megastar Foods Ltd has reached a fresh 52-week high, marking a 31.4% gain over the past year and outpacing the Sensex’s decline of 7.9%. This milestone reflects a powerful alignment of technical indicators and sustained price momentum that has propelled the stock well above its key moving averages.
Read More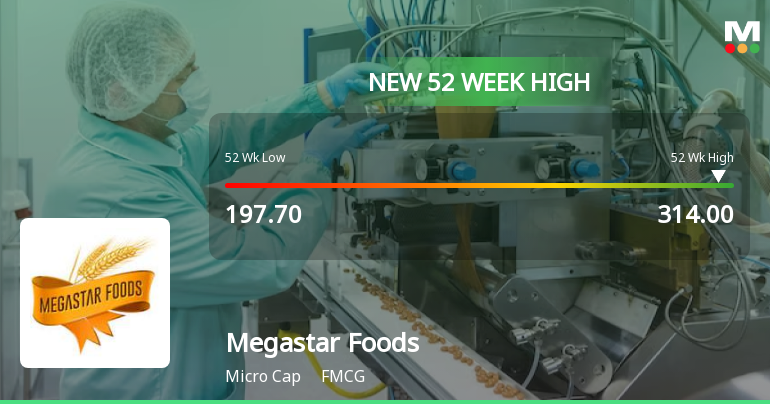
Broad-Based Technical Strength Lifts Megastar Foods Ltd to 52-Week High of Rs 314
With a decisive surge to Rs 314 on 13 May 2026, Megastar Foods Ltd has reached a fresh 52-week high, marking a significant milestone in its price momentum. This rally is underpinned by a confluence of bullish technical indicators and sustained upward price action, setting the stage for continued market attention.
Read More Announcements
Clarification Regarding Intimation Under Regulation 30 Of SEBI (Listing Obligations And Disclosure Requirements) Regulations 2015
16-Jun-2026 | Source : BSEClarification regarding intimation under Regulation 30 of SEBI (Listing Obligation and Disclosure Requirements) Regulation 2015
Disclosure Under Regulation 30 Of SEBI (Listing Obligations And Disclosure Requirements) Regulation 2015
15-Jun-2026 | Source : BSEDisclosure under Regulation 30 of SEBI (Listing Obligation and Disclosure Requirement) regulation 2015
Board Meeting Outcome for Outcome Of Board Meeting Held On June 09 2026 For Appointment Of Company Secretary And Compliance Officer
09-Jun-2026 | Source : BSEIntimation of outcome of Board Meeting dated 09.06.2026
Corporate Actions

No Upcoming Board Meetings

No Dividend history available

No Splits history available

No Bonus history available

No Rights history available
Quality key factors
Valuation key factors
Technicals key factors
 Technical Indicator Scale: Bearish, Mildly Bearish, Sideways, Mildly Bullish, Bullish Turned
 Shareholding Snapshot : Mar 2026
Shareholding Compare (%holding)
Promoters
None
Held by 0 Schemes
Held by 5 FIIs (1.72%)
Vikas Goel (22.96%)
Beeline Consultancy Services Private Limited (7.01%)
17.1%
Quarterly Results Snapshot (Consolidated) - Mar'26 - QoQ

QoQ Growth in quarter ended Mar 2026 is 3.43% vs 2.35% in Dec 2025

QoQ Growth in quarter ended Mar 2026 is -26.80% vs 28.57% in Dec 2025
Half Yearly Results Snapshot (Consolidated) - Sep'25
Growth in half year ended Sep 2025 is 73.12% vs 1.41% in Sep 2024
Growth in half year ended Sep 2025 is 102.58% vs -52.80% in Sep 2024
Nine Monthly Results Snapshot (Consolidated) - Dec'25
YoY Growth in nine months ended Dec 2025 is 64.90% vs 10.41% in Dec 2024
YoY Growth in nine months ended Dec 2025 is 192.47% vs -56.31% in Dec 2024
Annual Results Snapshot (Consolidated) - Mar'26
YoY Growth in year ended Mar 2026 is 47.52% vs 31.31% in Mar 2025
YoY Growth in year ended Mar 2026 is 145.38% vs -40.03% in Mar 2025
About Megastar Foods Ltd


