Dashboard
Healthy long term growth as Net Sales has grown by an annual rate of 16.21%
The company has declared Positive results for the last 7 consecutive quarters
Stock is technically in a Bullish range
With ROCE of 11, it has a Attractive valuation with a 4 Enterprise value to Capital Employed
Stock DNA
Retailing
INR 10,286 Cr (Small Cap)
47.00
76
0.00%
0.37
10.57%
5.25
Total Returns (Price + Dividend) 
Medplus Health for the last several years.
Risk Adjusted Returns v/s
Returns Beta

News
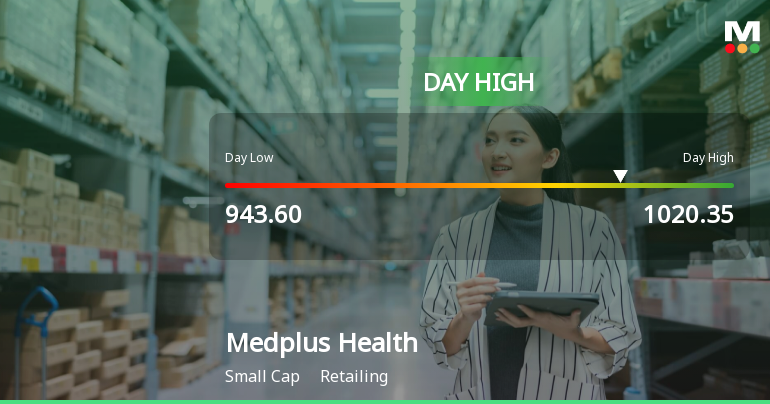
Medplus Health Services Ltd Surges 8.2% to Day's High of Rs 982.35 — Outperforms Sector by 6.94 Percentage Points
The Sensex edged up 0.32% while Medplus Health Services Ltd surged 8.2% on 21 May 2026, outperforming its Retailing sector by nearly 7 percentage points. This sharp single-session gain rewrites the short-term narrative for the small-cap stock, which has been on a strong upward trajectory over recent months.
Read More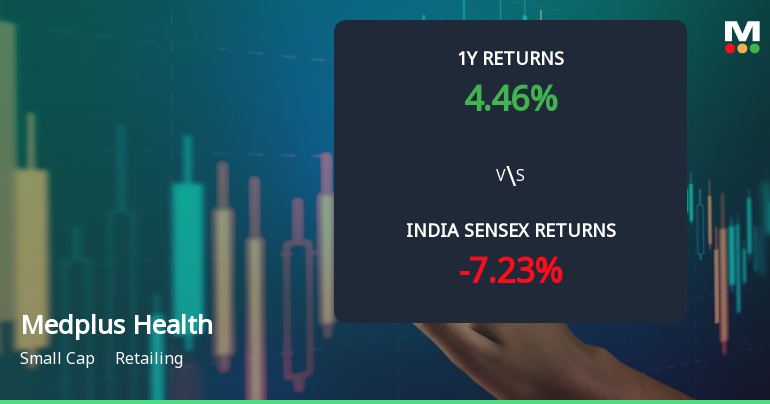
Medplus Health Services Ltd Technical Momentum Shifts Signal Bullish Outlook
Medplus Health Services Ltd has witnessed a notable shift in its technical momentum, moving from a mildly bullish stance to a more confident bullish trend. This change is underscored by a combination of technical indicators including MACD, moving averages, and Bollinger Bands, suggesting a positive outlook despite a recent dip in price.
Read More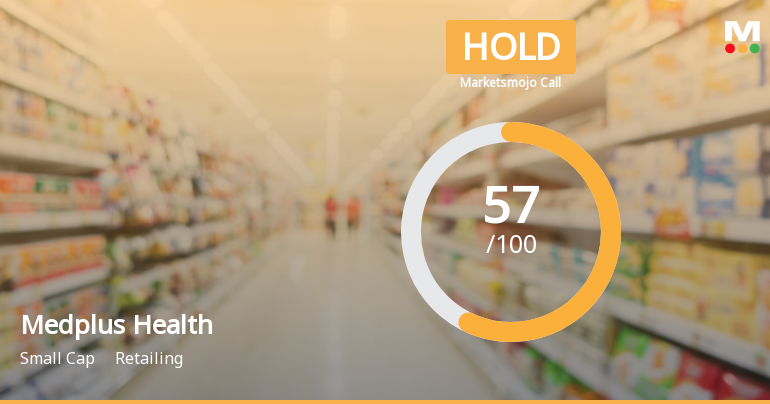
Medplus Health Services Ltd is Rated Hold by MarketsMOJO
Medplus Health Services Ltd is rated 'Hold' by MarketsMOJO, with this rating last updated on 16 Mar 2026. However, the analysis and financial metrics discussed here reflect the company’s current position as of 11 May 2026, providing investors with the latest insights into its performance and outlook.
Read More Announcements
Announcement under Regulation 30 (LODR)-Cessation
10-Jun-2026 | Source : BSEIntimation under Regulation 30 of the SEBI (Listing Obligations and Disclosure Requirements) Regulations2015 regarding completion of tenure of Mr.Madhavan Ganesan (DIN: 01674529) and Mr.Murali Sivaraman (DIN:01461231) as Non-Executive Independent Directors of the Company.
Update Under Regulation 30 Read With Para A Part A Of Schedule III Of SEBI (Listing Obligations And Disclosure Requirements) Regulations 2015
10-Jun-2026 | Source : BSEUpdate under Regulation 30 read with Para A Part A of Schedule III of SEBI (Listing Obligations and Disclosure Requirements) Regulations 2015
Update Under Regulation 30 Read With Para A Part A Of Schedule III Of SEBI (Listing Obligations And Disclosure Requirements) Regulations 2015
05-Jun-2026 | Source : BSEUpdate under Regulation 30 read with Para A Part A of Schedule III of SEBI (Listing Obligations and Disclosure Requirements) Regulations 2015
Corporate Actions

No Upcoming Board Meetings

No Dividend history available

No Splits history available

No Bonus history available

No Rights history available
Quality key factors
Valuation key factors
Technicals key factors
 Technical Indicator Scale: Bearish, Mildly Bearish, Sideways, Mildly Bullish, Bullish Turned
 Shareholding Snapshot : Mar 2026
Shareholding Compare (%holding)
Promoters
60.7445
Held by 17 Schemes (22.6%)
Held by 146 FIIs (15.53%)
Lone Furrow Investments Private Limited (14.39%)
Nippon Life India Trustee Ltd-a/c Nippon India Mul (7.54%)
11.82%
Quarterly Results Snapshot (Consolidated) - Mar'26 - QoQ

QoQ Growth in quarter ended Mar 2026 is 3.23% vs 7.55% in Dec 2025

QoQ Growth in quarter ended Mar 2026 is 10.67% vs 4.16% in Dec 2025
Half Yearly Results Snapshot (Consolidated) - Sep'25
Growth in half year ended Sep 2025 is 5.12% vs 13.82% in Sep 2024
Growth in half year ended Sep 2025 is 84.29% vs 189.37% in Sep 2024
Nine Monthly Results Snapshot (Consolidated) - Dec'25
YoY Growth in nine months ended Dec 2025 is 8.68% vs 11.90% in Dec 2024
YoY Growth in nine months ended Dec 2025 is 57.26% vs 208.57% in Dec 2024
Annual Results Snapshot (Consolidated) - Mar'26
YoY Growth in year ended Mar 2026 is 12.33% vs 9.09% in Mar 2025
YoY Growth in year ended Mar 2026 is 46.12% vs 129.60% in Mar 2025
About Medplus Health Services Ltd

Company Coordinates