Dashboard
Weak Long Term Fundamental Strength with a -6.25% CAGR growth in Operating Profits over the last 5 years
- Company's ability to service its debt is weak with a poor EBIT to Interest (avg) ratio of 1.75
- The company has been able to generate a Return on Equity (avg) of 8.67% signifying low profitability per unit of shareholders funds
Positive results in Dec 25
Stock is technically in a Mildly Bullish range
With ROCE of 8.3, it has a Attractive valuation with a 1.8 Enterprise value to Capital Employed
Falling Participation by Institutional Investors
Stock DNA
Cement & Cement Products
INR 2,324 Cr (Small Cap)
15.00
33
0.18%
0.58
8.56%
2.37
Total Returns (Price + Dividend) 
Latest dividend: 1.5106345640881653 per share ex-dividend date: Aug-14-2025
Risk Adjusted Returns v/s
Returns Beta

News

Mangalam Cement Ltd Technical Momentum Shifts Amid Mixed Market Signals
Mangalam Cement Ltd has experienced a nuanced shift in its technical momentum, moving from a bullish to a mildly bullish stance as of early May 2026. Despite a recent decline in daily price, key technical indicators such as MACD and moving averages suggest a cautiously optimistic outlook, while other signals present a more complex picture for investors navigating the cement sector.
Read More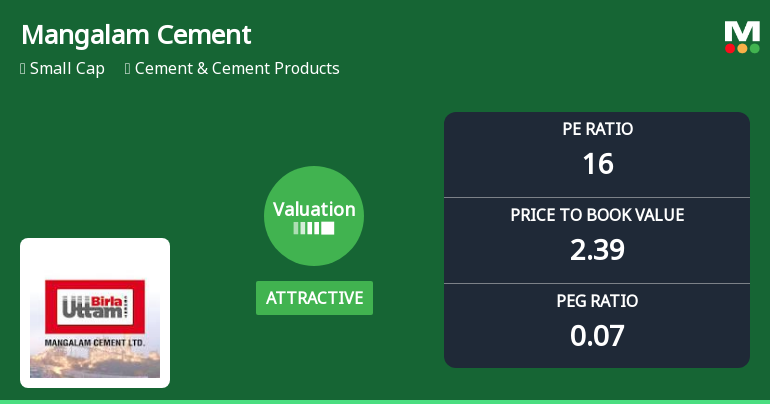
Mangalam Cement Ltd Valuation Shifts Signal Renewed Price Attractiveness
Mangalam Cement Ltd has witnessed a notable shift in its valuation parameters, moving from a fair to an attractive rating, signalling a potential opportunity for investors amid a challenging market backdrop. Despite a recent dip in share price, the company’s price-to-earnings (P/E) and price-to-book value (P/BV) ratios now present a more compelling entry point compared to historical averages and peer benchmarks.
Read More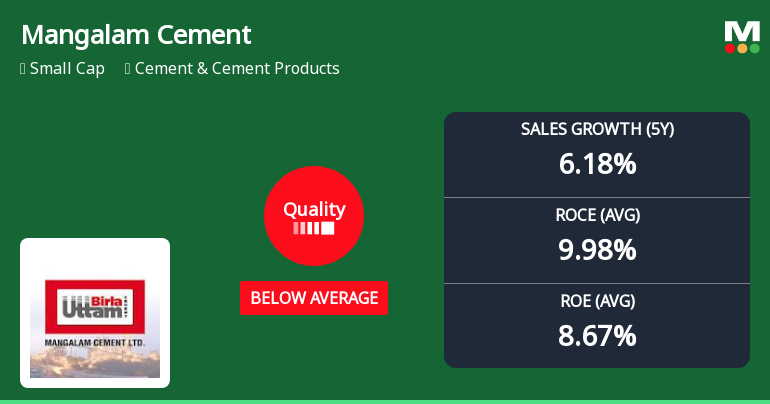
Mangalam Cement Ltd Quality Parameters Deteriorate Amid Mixed Financial Performance
Mangalam Cement Ltd has seen a notable shift in its quality grading from average to below average, reflecting a deterioration in key business fundamentals. Despite a strong long-term stock return outperforming the Sensex, recent financial metrics reveal challenges in profitability, debt management, and operational efficiency that investors should carefully consider.
Read More Announcements
Announcement under Regulation 30 (LODR)-Newspaper Publication
13-Jun-2026 | Source : BSESubmission of Copy of the Newspaper Advertisements in respect of transfer of equity shares of the company to the Investor Education and Protection Fund (IEPF) Authority
Announcement under Regulation 30 (LODR)-Newspaper Publication
05-Jun-2026 | Source : BSENewspaper Publication
Compliances-Reg.24(A)-Annual Secretarial Compliance
28-May-2026 | Source : BSEAnnual Secretarial Compliance Report for the financial year ended 31st March 2026 issued by the Pinchaa & Co.
Corporate Actions

No Upcoming Board Meetings

Mangalam Cement Ltd has declared 15% dividend, ex-date: 14 Aug 25

No Splits history available

No Bonus history available

No Rights history available
Quality key factors
Valuation key factors
Technicals key factors
 Technical Indicator Scale: Bearish, Mildly Bearish, Sideways, Mildly Bullish, Bullish Turned
 Shareholding Snapshot : Mar 2026
Shareholding Compare (%holding)
Non Institution
None
Held by 1 Schemes (4.21%)
Held by 35 FIIs (5.59%)
Vidula Consultancy Services Limited (16.68%)
Elm Park Fund Limited (4.46%)
24.86%
Quarterly Results Snapshot (Standalone) - Dec'25 - QoQ

QoQ Growth in quarter ended Dec 2025 is 6.71% vs -12.59% in Sep 2025

QoQ Growth in quarter ended Dec 2025 is -43.56% vs -37.66% in Sep 2025
Half Yearly Results Snapshot (Standalone) - Sep'25
Growth in half year ended Sep 2025 is 14.45% vs -12.85% in Sep 2024
Growth in half year ended Sep 2025 is 157.42% vs -23.19% in Sep 2024
Nine Monthly Results Snapshot (Standalone) - Dec'25
YoY Growth in nine months ended Dec 2025 is 7.63% vs -8.55% in Dec 2024
YoY Growth in nine months ended Dec 2025 is 126.32% vs -33.66% in Dec 2024
Annual Results Snapshot (Standalone) - Mar'25
YoY Growth in year ended Mar 2025 is -2.58% vs -4.22% in Mar 2024
YoY Growth in year ended Mar 2025 is -24.55% vs 248.83% in Mar 2024
About Mangalam Cement Ltd


