Dashboard
Weak Long Term Fundamental Strength with an average Return on Equity (ROE) of 7.42%
With a growth in Net Profit of 43.08%, the company declared Very Positive results in Dec 25
Stock is technically in a Mildly Bullish range
With ROE of 9.7, it has a Fair valuation with a 2.7 Price to Book Value
Majority shareholders : Promoters
Market Beating performance in long term as well as near term
Stock DNA
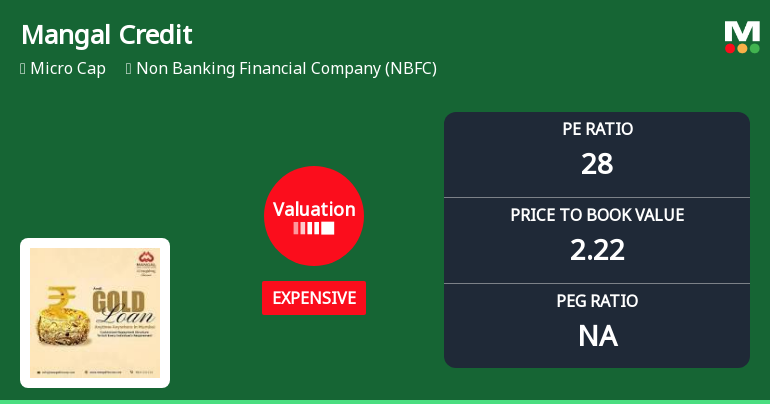
Non Banking Financial Company (NBFC)
INR 456 Cr (Micro Cap)
29.00
21
0.33%
1.75
7.79%
2.61
Total Returns (Price + Dividend) 
Latest dividend: 0.7 per share ex-dividend date: Sep-17-2025
Risk Adjusted Returns v/s
Returns Beta

News
Mangal Credit & Fincorp Ltd Valuation Shifts Signal Price Attractiveness Challenges
Mangal Credit & Fincorp Ltd, a micro-cap player in the Non Banking Financial Company (NBFC) sector, has seen its valuation parameters shift notably towards the expensive territory, prompting a downgrade in its investment grade to Strong Sell. Despite modest price gains and a positive return over the past year, the company’s elevated price-to-earnings (P/E) and price-to-book value (P/BV) ratios relative to peers and historical averages raise concerns about its price attractiveness for investors.
Read More
Mangal Credit & Fincorp Ltd is Rated Sell
Mangal Credit & Fincorp Ltd is rated 'Sell' by MarketsMOJO, with this rating last updated on 20 Apr 2026. However, the analysis and financial metrics discussed here reflect the stock's current position as of 13 May 2026, providing investors with the latest insights into its performance and outlook.
Read More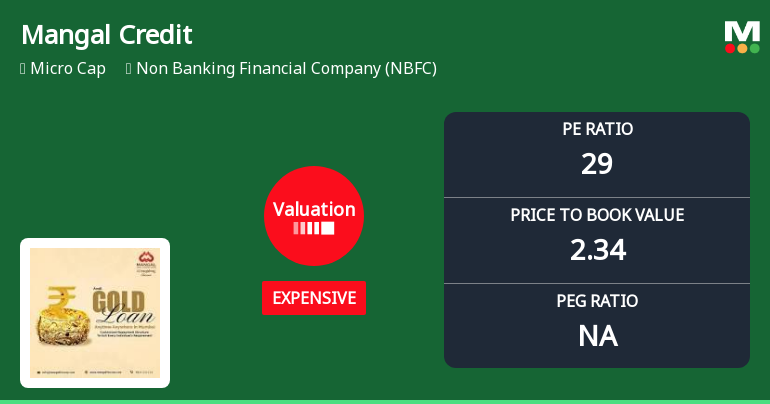
Mangal Credit & Fincorp Ltd Valuation Shifts Signal Price Attractiveness Challenges
Mangal Credit & Fincorp Ltd, a micro-cap player in the Non Banking Financial Company (NBFC) sector, has seen its valuation parameters shift notably, raising questions about its price attractiveness relative to historical levels and peer benchmarks. The company’s price-to-earnings (P/E) ratio has climbed to 29.20, moving from a previously fair valuation to an expensive territory, while its price-to-book value (P/BV) stands at 2.34. These changes come amid a mixed performance backdrop and evolving market sentiment, prompting a reassessment of the stock’s investment appeal.
Read More Announcements
Announcement under Regulation 30 (LODR)-Credit Rating
16-Jun-2026 | Source : BSEPlease find herewith the intimation of rating assigned to the Non-Convertible Debentures.
Announcement under Regulation 30 (LODR)-Newspaper Publication
30-May-2026 | Source : BSEAttached herewith copies of the newspaper clippings published in News Hub and Pratahkal Marathi contain the extract of the Audited Financial Results for the quarter and financial year ended March 31 2026.
Compliances-Reg.24(A)-Annual Secretarial Compliance
29-May-2026 | Source : BSEEnclosed herewith Annual Secretarial Compliance Report for the year ended March 31 2026.
Corporate Actions

No Upcoming Board Meetings

Mangal Credit & Fincorp Ltd has declared 7% dividend, ex-date: 17 Sep 25

Mangal Credit & Fincorp Ltd has announced 10:1 stock split, ex-date: 26 Nov 18

Mangal Credit & Fincorp Ltd has announced 5:1 bonus issue, ex-date: 17 Dec 15

No Rights history available
Quality key factors
Valuation key factors
Technicals key factors
 Technical Indicator Scale: Bearish, Mildly Bearish, Sideways, Mildly Bullish, Bullish Turned
 Shareholding Snapshot : Mar 2026
Shareholding Compare (%holding)
Promoters
None
Held by 0 Schemes
Held by 2 FIIs (0.0%)
Meghraj Sohanlal Jain (22.67%)
E Ally Consulting India Private Limited (7.96%)
22.93%
Quarterly Results Snapshot (Standalone) - Mar'26 - QoQ

QoQ Growth in quarter ended Mar 2026 is 16.33% vs 15.74% in Dec 2025
QoQ Growth in quarter ended Mar 2026 is 43.08% vs 28.52% in Dec 2025
Half Yearly Results Snapshot (Standalone) - Sep'25

Growth in half year ended Sep 2025 is 28.73% vs 55.93% in Sep 2024
Growth in half year ended Sep 2025 is -14.06% vs 36.67% in Sep 2024
Nine Monthly Results Snapshot (Standalone) - Dec'25
YoY Growth in nine months ended Dec 2025 is 34.22% vs 52.33% in Dec 2024
YoY Growth in nine months ended Dec 2025 is -6.03% vs 31.28% in Dec 2024
Annual Results Snapshot (Standalone) - Mar'26
YoY Growth in year ended Mar 2026 is 40.98% vs 49.34% in Mar 2025
YoY Growth in year ended Mar 2026 is 17.14% vs 23.89% in Mar 2025
About Mangal Credit & Fincorp Ltd


