Stock DNA
Non Banking Financial Company (NBFC)
INR 658 Cr (Micro Cap)
14.00
21
0.69%
3.78
10.84%
1.59
Total Returns (Price + Dividend) 
Latest dividend: 0.5 per share ex-dividend date: Nov-21-2025
Risk Adjusted Returns v/s
Returns Beta

News

Manba Finance Ltd Upgraded to Sell: A Detailed Analysis of Quality, Valuation, Financial Trend and Technicals
Manba Finance Ltd, a micro-cap player in the Non Banking Financial Company (NBFC) sector, has seen its investment rating upgraded from Strong Sell to Sell as of 19 May 2026. This change reflects nuanced shifts across valuation, technical indicators, financial trends, and quality assessments, signalling a cautious but slightly more favourable outlook amid persistent challenges.
Read More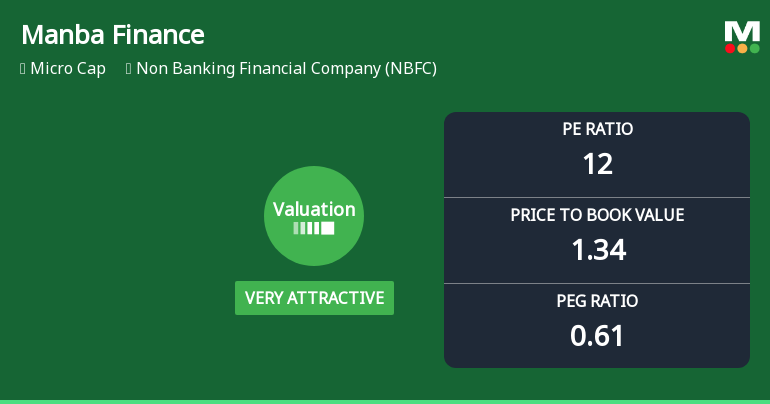
Manba Finance Ltd Valuation Shifts Signal Renewed Price Attractiveness Amid Sector Challenges
Manba Finance Ltd, a micro-cap player in the Non Banking Financial Company (NBFC) sector, has witnessed a notable shift in its valuation parameters, moving from an attractive to a very attractive price level. Despite a challenging year-to-date return of -22.7%, the company’s improved price-to-earnings (P/E) and price-to-book value (P/BV) ratios relative to peers suggest a potential re-rating opportunity for investors seeking value in the NBFC space.
Read MoreAre Manba Finance Ltd latest results good or bad?
Manba Finance Ltd's latest financial results for Q4 FY26 present a complex picture of growth and challenges. The company reported net sales of ₹92.37 crores, reflecting a year-on-year growth of 39.81% and a sequential increase of 7.21%. This marks the highest quarterly revenue in its history, indicating robust top-line expansion. However, the net profit for the same quarter was ₹11.13 crores, which represents a sequential decline of 14.92% compared to the previous quarter, alongside a drop in the profit after tax (PAT) margin to 12.05% from 15.18% in Q3 FY26. The operational performance highlights a concerning trend of margin compression despite strong revenue growth. The operating margin also contracted to 65.71%, down from 70.15% in the prior quarter. This decline in profitability metrics raises questions about the sustainability of earnings, particularly as interest expenses surged to ₹42.62 crores, ref...
Read More Announcements
General Update
16-Jun-2026 | Source : BSEGeneral Update on a one to one meet of senior management of company held with an Analysts/Investors on 16-06-2026.
Announcement under Regulation 30 (LODR)-Press Release / Media Release
16-Jun-2026 | Source : BSEPress Release - under regulation 30 of SEBI LODR
Announcement under Regulation 30 (LODR)-Analyst / Investor Meet - Intimation
09-Jun-2026 | Source : BSEIntimation of investor meet to be held on 16-06-2026.
Corporate Actions

No Upcoming Board Meetings

Manba Finance Ltd has declared 2% dividend, ex-date: 06 Feb 26

No Splits history available

No Bonus history available

No Rights history available
Quality key factors
Valuation key factors
Technicals key factors
 Technical Indicator Scale: Bearish, Mildly Bearish, Sideways, Mildly Bullish, Bullish Turned
 Shareholding Snapshot : Mar 2026
Shareholding Compare (%holding)
Promoters
None
Held by 0 Schemes
Held by 4 FIIs (0.87%)
Manba Investments & Securities Pvt Ltd (27.68%)
Chartered Finance & Leasing Limited (1.68%)
18.21%
Quarterly Results Snapshot (Standalone) - Mar'26 - QoQ

QoQ Growth in quarter ended Mar 2026 is 7.21% vs 19.12% in Dec 2025
QoQ Growth in quarter ended Mar 2026 is -14.91% vs 14.74% in Dec 2025
Half Yearly Results Snapshot (Standalone) - Sep'25
Growth in half year ended Sep 2025 is 27.74% vs 43.16% in Sep 2024

Growth in half year ended Sep 2025 is 25.74% vs 1.57% in Sep 2024
Nine Monthly Results Snapshot (Standalone) - Dec'25
YoY Growth in nine months ended Dec 2025 is 30.04% vs 2.38% in Dec 2024
YoY Growth in nine months ended Dec 2025 is 14.94% vs 7.55% in Dec 2024
Annual Results Snapshot (Standalone) - Mar'26
YoY Growth in year ended Mar 2026 is 31.82% vs 41.24% in Mar 2025
YoY Growth in year ended Mar 2026 is 20.00% vs 21.23% in Mar 2025
About Manba Finance Ltd

Company Coordinates