Dashboard
Company has a low Debt to Equity ratio (avg) at 0 times
Poor long term growth as Operating profit has grown by an annual rate -3.13% of over the last 5 years
Flat results in Mar 26
Stock is technically in a Mildly Bullish range
With ROE of 10.5, it has a Fair valuation with a 0.8 Price to Book Value
Despite the size of the company, domestic mutual funds hold only 0% of the company
Stock DNA
Ferrous Metals
INR 3,461 Cr (Small Cap)
8.00
13
1.51%
-0.43
10.79%
0.79
Total Returns (Price + Dividend) 
Latest dividend: 11 per share ex-dividend date: May-22-2026
Risk Adjusted Returns v/s
Returns Beta

News
Are Maithan Alloys Ltd. latest results good or bad?
Maithan Alloys Ltd.'s latest financial results for Q4 FY26 present a complex picture of operational performance overshadowed by significant exceptional items. The company reported a consolidated net loss of ₹70.44 crores, which reflects a substantial decline compared to the previous quarter's profit. This downturn was primarily driven by a sharp negative shift in other income, which turned to a loss of ₹158.96 crores from a positive figure in the prior quarter. Despite the headline loss, the underlying operational metrics indicate a recovery in core business activities. Net sales increased by 14.05% quarter-on-quarter to ₹559.18 crores, marking a reversal from the previous quarter's flat performance. Year-on-year, this represents a robust growth of 28.48%, suggesting strong demand recovery in the ferro alloys segment. Furthermore, the operating profit before depreciation, interest, tax, and other income (...
Read More
Maithan Alloys Ltd. is Rated Sell by MarketsMOJO
Maithan Alloys Ltd. is rated 'Sell' by MarketsMOJO, with this rating last updated on 20 Apr 2026. However, the analysis and financial metrics discussed here reflect the stock's current position as of 13 May 2026, providing investors with an up-to-date view of the company’s fundamentals, returns, and market standing.
Read More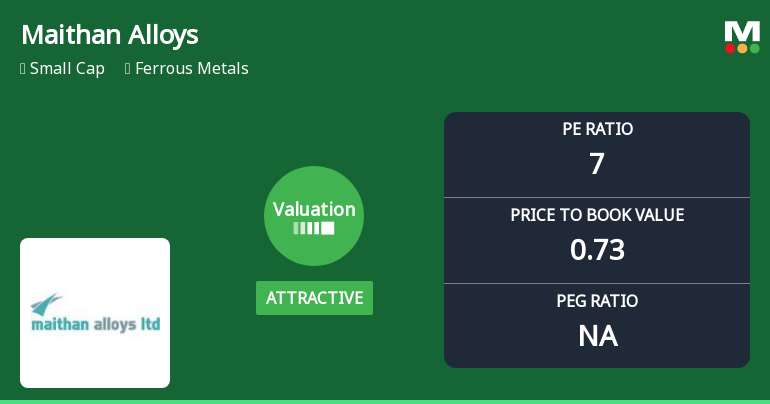
Maithan Alloys Ltd: Valuation Shift Enhances Price Attractiveness Amid Mixed Market Returns
Maithan Alloys Ltd has witnessed a notable improvement in its valuation parameters, shifting from very attractive to attractive territory, signalling a potential inflection point for investors. Despite a modest day change of 0.06%, the stock’s price-to-earnings (P/E) and price-to-book value (P/BV) ratios now present a compelling case when contrasted with both historical averages and peer benchmarks within the ferrous metals sector.
Read More Announcements
Announcement under Regulation 30 (LODR)-Scheme of Arrangement
11-Jun-2026 | Source : BSEAn update on the Scheme of Amalgamation/Merger between Impex Metal & Ferro Alloys Limited and Maithan Alloys Limited.
Announcement under Regulation 30 (LODR)-Acquisition
10-Jun-2026 | Source : BSEAcquisition of Equity Shares through Stock Exchange.
Announcement under Regulation 30 (LODR)-Newspaper Publication
28-May-2026 | Source : BSENewspaper publication regarding prior intimation for transfer of shares to the Investor Education and Protection Funds.
Corporate Actions

No Upcoming Board Meetings

Maithan Alloys Ltd. has declared 110% dividend, ex-date: 22 May 26

No Splits history available

Maithan Alloys Ltd. has announced 1:1 bonus issue, ex-date: 15 Jul 15

No Rights history available
Quality key factors
Valuation key factors
Technicals key factors
 Technical Indicator Scale: Bearish, Mildly Bearish, Sideways, Mildly Bullish, Bullish Turned
 Shareholding Snapshot : Dec 2025
Shareholding Compare (%holding)
Promoters
None
Held by 0 Schemes
Held by 41 FIIs (1.24%)
Subhas Chandra Agarwalla (25.63%)
None
18.55%
Quarterly Results Snapshot (Consolidated) - Mar'26 - QoQ

QoQ Growth in quarter ended Mar 2026 is 14.05% vs -0.11% in Dec 2025

QoQ Growth in quarter ended Mar 2026 is -179.24% vs 173.50% in Dec 2025
Half Yearly Results Snapshot (Consolidated) - Sep'25
Growth in half year ended Sep 2025 is 33.82% vs -0.95% in Sep 2024
Growth in half year ended Sep 2025 is -30.84% vs 393.97% in Sep 2024
Nine Monthly Results Snapshot (Consolidated) - Dec'25
YoY Growth in nine months ended Dec 2025 is 17.73% vs 5.79% in Dec 2024
YoY Growth in nine months ended Dec 2025 is -27.07% vs 234.11% in Dec 2024
Annual Results Snapshot (Consolidated) - Mar'26
YoY Growth in year ended Mar 2026 is 20.32% vs 4.45% in Mar 2025
YoY Growth in year ended Mar 2026 is -31.19% vs 80.59% in Mar 2025
About Maithan Alloys Ltd.


