Dashboard
High Management Efficiency with a high ROCE of 26.05%
Strong ability to service debt as the company has a low Debt to EBITDA ratio of 0.87 times
Flat results in Mar 26
With ROE of 12.1, it has a Attractive valuation with a 2.7 Price to Book Value
Falling Participation by Institutional Investors
Stock DNA
Construction
INR 1,788 Cr (Small Cap)
19.00
26
0.00%
0.08
12.40%
2.67
Total Returns (Price + Dividend) 
M & B Engineer. for the last several years.
Risk Adjusted Returns v/s
Returns Beta

News
Are M & B Engineering Ltd latest results good or bad?
M & B Engineering Ltd's latest financial results for Q4 FY26 reflect a complex operational landscape characterized by robust revenue growth but significant challenges in profitability. The company reported net sales of ₹363.71 crores, which represents a year-on-year growth of 15.96% and a sequential increase of 3.47%. However, this revenue expansion did not translate into improved profitability, as net profit for the quarter was ₹27.00 crores, reflecting a year-on-year decline of 5.33% despite a sequential increase of 5.92%. Operating margins have come under pressure, contracting to 10.41%, which is the lowest level in the past four quarters and significantly below the 13.25% margin recorded in the same quarter last year. This decline raises concerns regarding the company's pricing power and cost management in a competitive construction sector. The operating profit margin's contraction suggests potential i...
Read More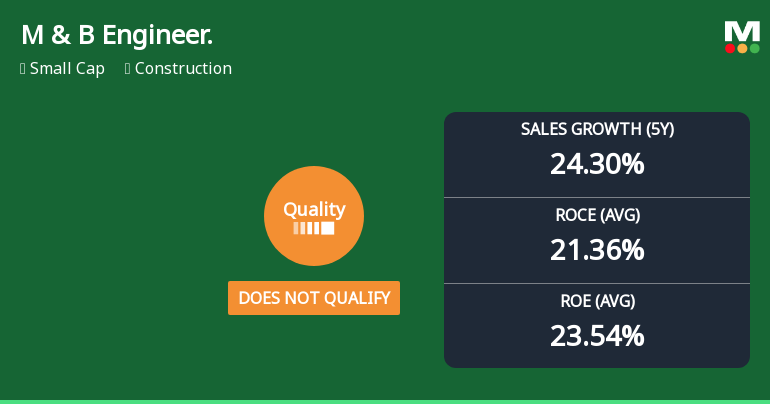
M & B Engineering Ltd Quality Grade Upgrade Reflects Strengthened Fundamentals
M & B Engineering Ltd, a small-cap player in the construction sector, has seen its quality grade upgraded from "does not qualify" to "good," reflecting significant improvements in its business fundamentals. Despite recent share price weakness, the company’s enhanced return ratios, manageable debt levels, and robust growth metrics indicate a strengthening operational profile that investors should carefully consider.
Read More Announcements
Disclosures under Reg. 29(2) of SEBI (SAST) Regulations 2011
12-Jun-2026 | Source : BSEThe Exchange has received the disclosure under Regulation 29(2) of SEBI (Substantial Acquisition of Shares & Takeovers) Regulations 2011 for Chirag Patel & Girishbhai Patel
Announcement under Regulation 30 (LODR)-Analyst / Investor Meet - Intimation
06-Jun-2026 | Source : BSEM & B Engineering Limited has informed the Exchange about Schedule of meet
Announcement under Regulation 30 (LODR)-Investor Presentation
01-Jun-2026 | Source : BSEM&B Engineering Limited has informed the Stock Exchange about a clarification to the Investor Presentation submitted on 12th May 2026 regarding Cash Flow Statement slide
Corporate Actions

No Upcoming Board Meetings

No Dividend history available

No Splits history available

No Bonus history available

No Rights history available
Quality key factors
Valuation key factors
Technicals key factors
 Technical Indicator Scale: Bearish, Mildly Bearish, Sideways, Mildly Bullish, Bullish Turned
 Shareholding Snapshot : Mar 2026
Shareholding Compare (%holding)
Promoters
None
Held by 4 Schemes (4.99%)
Held by 10 FIIs (2.86%)
Girishbhai Manibhai Patel (27.13%)
Abu Dhabi Investment Authority - Stable (2.26%)
12.44%
Quarterly Results Snapshot (Standalone) - Mar'26 - QoQ

QoQ Growth in quarter ended Mar 2026 is 11.48% vs 8.36% in Dec 2025

QoQ Growth in quarter ended Mar 2026 is -25.27% vs 40.07% in Dec 2025
Half Yearly Results Snapshot (Standalone) - Sep'25
Not Applicable: The company has declared_date for only one period
Not Applicable: The company has declared_date for only one period
Nine Monthly Results Snapshot (Standalone) - Dec'25
Not Applicable: The company has declared_date for only one period
Not Applicable: The company has declared_date for only one period
Annual Results Snapshot (Standalone) - Mar'26
Not Applicable: The company has declared_date for only one period
Not Applicable: The company has declared_date for only one period
About M & B Engineering Ltd

Company Coordinates