Dashboard
With a Negative Book Value, the company has a Weak Long Term Fundamental Strength
- Poor long term growth as Net Sales has grown by an annual rate of 369.00% and Operating profit at 0% over the last 5 years
- High Debt Company with a Debt to Equity ratio (avg) at 0 times
Risky - Negative Book Value
Stock DNA
Industrial Manufacturing
INR 7 Cr (Micro Cap)
237.00
36
0.00%
0.50
48.00%
-7.47
Total Returns (Price + Dividend) 
Lexoraa Ind for the last several years.
Risk Adjusted Returns v/s
Returns Beta

News
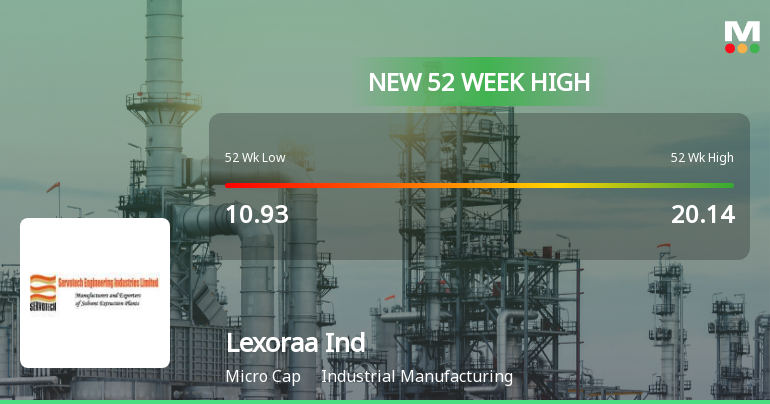
Broad-Based Technical Strength Lifts Lexoraa Industries Ltd to 52-Week High of Rs 21
With a decisive surge to Rs 21 on 27 Apr 2026, Lexoraa Industries Ltd has reached a fresh 52-week high, marking a 60.67% gain over the past year. This milestone is underscored by a strong alignment of technical indicators and sustained price momentum, setting the stock apart in the industrial manufacturing sector.
Read More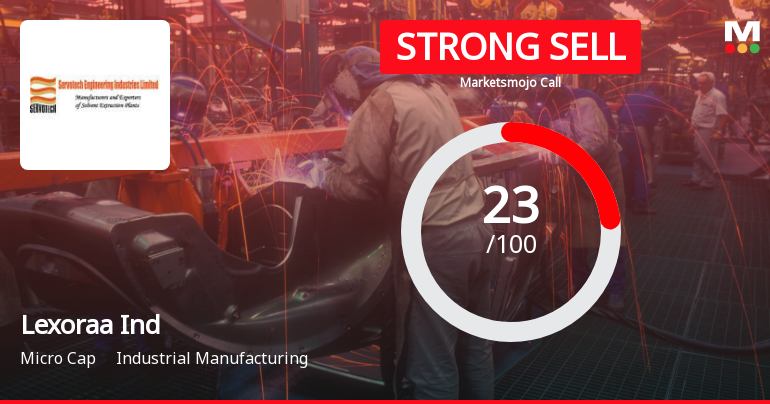
Lexoraa Industries Downgraded to Strong Sell Amid Technical and Fundamental Weaknesses
Lexoraa Industries Ltd, a micro-cap player in the industrial manufacturing sector, has seen its investment rating downgraded from Sell to Strong Sell as of 9 April 2026. This shift reflects deteriorating technical indicators, stagnant financial trends, weak valuation metrics, and declining quality scores, signalling heightened risk for investors despite recent stock price volatility.
Read More Announcements
Board Meeting Outcome for Audited Financial Result For The Year Ended On 31St March 2026
25-May-2026 | Source : BSEaudited financial result for the year ended 31st march 2026
Audited Financial Results For The Year Ended On 31St March 2026
25-May-2026 | Source : BSEaudited financial results for the year ended on 31st march 2026
Redesignation Of Cfo As Executive Director & Chief Financial Officer
30-Apr-2026 | Source : BSEredesignation of cfo
Corporate Actions

No Upcoming Board Meetings

No Dividend history available

No Splits history available

No Bonus history available

No Rights history available
Quality key factors
Valuation key factors
Technicals key factors
 Technical Indicator Scale: Bearish, Mildly Bearish, Sideways, Mildly Bullish, Bullish Turned
 Shareholding Snapshot : Mar 2026
Shareholding Compare (%holding)
Non Institution
None
Held by 0 Schemes
Held by 0 FIIs
None
Pals Overseas Pvt Ltd (1.3%)
61.5%
Quarterly Results Snapshot (Standalone) - Mar'26 - YoY

YoY Growth in quarter ended Mar 2026 is 302.75% vs 0.00% in Mar 2025
YoY Growth in quarter ended Mar 2026 is 600.00% vs 76.92% in Mar 2025
Half Yearly Results Snapshot (Standalone) - Sep'25
Growth in half year ended Sep 2025 is 1,565.38% vs 0.00% in Sep 2024
Growth in half year ended Sep 2025 is 54.84% vs -342.86% in Sep 2024
Nine Monthly Results Snapshot (Standalone) - Dec'25
YoY Growth in nine months ended Dec 2025 is 577.78% vs 0.00% in Dec 2024
YoY Growth in nine months ended Dec 2025 is 73.33% vs -350.00% in Dec 2024
Annual Results Snapshot (Standalone) - Mar'26
YoY Growth in year ended Mar 2026 is 369.05% vs 0.00% in Mar 2025
YoY Growth in year ended Mar 2026 is 104.17% vs -100.00% in Mar 2025
About Lexoraa Industries Ltd


