Dashboard
Weak Long Term Fundamental Strength with an average Return on Equity (ROE) of 12.56%
With a growth in Net Profit of 40.84%, the company declared Very Positive results in Mar 26
With ROE of 10.7, it has a Attractive valuation with a 1.3 Price to Book Value
Falling Participation by Institutional Investors
Stock DNA
Non Banking Financial Company (NBFC)
INR 576 Cr (Micro Cap)
12.00
21
0.00%
2.57
8.27%
1.26
Total Returns (Price + Dividend) 
Laxmi India Fin. for the last several years.
Risk Adjusted Returns v/s
Returns Beta

News
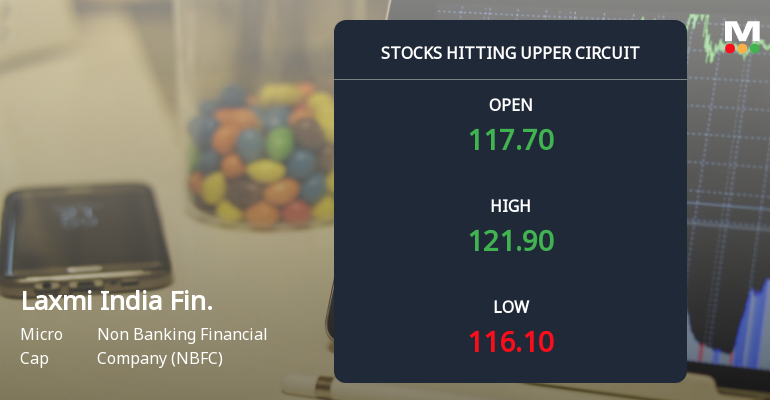
Laxmi India Finance Ltd Locks at Upper Circuit With 5% Gain — Buyers Queue, Sellers Absent
At Rs 122.6, the buying was done — not because demand dried up, but because the exchange wouldn't let the stock go any higher. Laxmi India Finance Ltd locked at its upper circuit of 5% on 21 May 2026, with buyers queuing and no sellers willing to part with shares.
Read More
Laxmi India Finance Ltd Locks at Lower Circuit With 4.99% Loss — Sellers Queue, No Buyers in Sight
At Rs 131.75, Laxmi India Finance Ltd locked at its lower circuit on 12 May 2026, reflecting a 4.99% decline within a 5% price band. The session was characterised by unfilled supply as sellers queued up to exit but buyers remained absent, freezing the price at the floor level.
Read More Announcements
Announcement under Regulation 30 (LODR)-Allotment of ESOP / ESPS
26-May-2026 | Source : BSEWe wish to inform you that the Company by way of Circular Resolution has allotted 125203 equity shares of Rs. 5/- each pursuant to Laxmi India Finance Limited Employee Stock Option Scheme-2023.
Compliances-Reg.24(A)-Annual Secretarial Compliance
25-May-2026 | Source : BSEAnnual Secretarial Compliance Report for the Financial Year ended March 31 2026
Announcement under Regulation 30 (LODR)-Earnings Call Transcript
19-May-2026 | Source : BSEIn continuation to our letters dated May 07 2026 and May 13 2026 we hereby inform you that pursuant to Regulations 30 and 46 of the Securities and Exchange Board of India (Listing Obligations and Disclosure Requirements) Regulations 2015 the transcript of the Earnings Call with analysts and investors held on Thursday May 14 2026 at 12:30 P.M. in relation to the Audited Standalone Financial Results of the Company for the quarter and Financial year ended March 31 2026 has been uploaded on the website of the Company.
Corporate Actions

No Upcoming Board Meetings

No Dividend history available

No Splits history available

No Bonus history available

No Rights history available
Quality key factors
Valuation key factors
Technicals key factors
 Technical Indicator Scale: Bearish, Mildly Bearish, Sideways, Mildly Bullish, Bullish Turned
 Shareholding Snapshot : Mar 2026
Shareholding Compare (%holding)
Promoters
None
Held by 0 Schemes
Held by 9 FIIs (1.58%)
Hirak Vinimay Private Limited (41.61%)
Mukul Mahavir Agrawal (3.83%)
25.64%
Quarterly Results Snapshot (Standalone) - Mar'26 - QoQ

QoQ Growth in quarter ended Mar 2026 is 17.77% vs 4.18% in Dec 2025
QoQ Growth in quarter ended Mar 2026 is 103.98% vs 7.02% in Dec 2025
Half Yearly Results Snapshot (Standalone) - Sep'25

Growth in half year ended Sep 2025 is 31.84% vs 50.82% in Sep 2024
Growth in half year ended Sep 2025 is 25.52% vs 163.45% in Sep 2024
Nine Monthly Results Snapshot (Standalone) - Dec'25
YoY Growth in nine months ended Dec 2025 is 30.76% vs 3.31% in Dec 2024
YoY Growth in nine months ended Dec 2025 is 36.44% vs -18.58% in Dec 2024
Annual Results Snapshot (Standalone) - Mar'26
YoY Growth in year ended Mar 2026 is 29.03% vs 41.91% in Mar 2025
YoY Growth in year ended Mar 2026 is 38.22% vs 60.21% in Mar 2025
About Laxmi India Finance Ltd

Company Coordinates