Dashboard
Weak Long Term Fundamental Strength with a 8.64% CAGR growth in Operating Profits over the last 5 years
- INTEREST(Q) At Rs 2.90 cr has Grown at 176.19%
- PBT LESS OI(Q) At Rs 10.70 cr has Fallen at -17.05%
- PAT(Q) At Rs 9.24 cr has Fallen at -16.5%
Underperformed the market in the last 1 year
Total Returns (Price + Dividend) 
Latest dividend: 0.2 per share ex-dividend date: Aug-18-2021
Risk Adjusted Returns v/s
Returns Beta

News
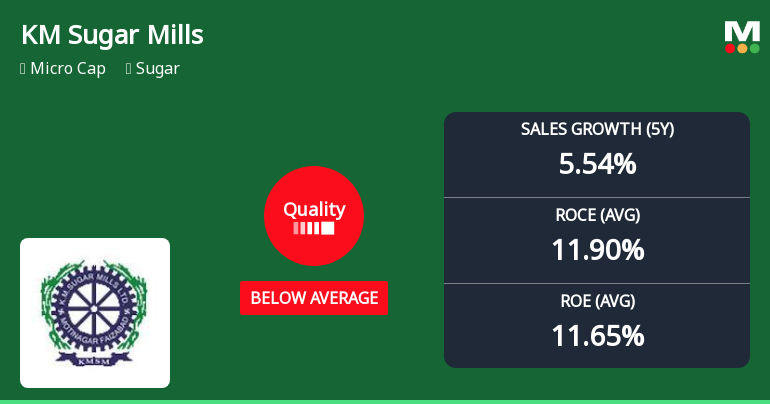
KM Sugar Mills Ltd Downgraded to Below Average Quality Amid Mixed Financial Signals
KM Sugar Mills Ltd has seen a notable downgrade in its quality grading from average to below average, prompting a shift in its MarketsMOJO rating from Hold to Sell as of 20 May 2026. This change reflects a deterioration in key business fundamentals including return ratios, debt metrics, and growth consistency, raising concerns about the company’s operational efficiency and financial health amid a challenging sugar sector environment.
Read MoreAre KM Sugar Mills Ltd latest results good or bad?
The latest financial results for KM Sugar Mills Ltd for the quarter ended March 2026 reveal significant operational challenges. The company reported net sales of ₹105.99 crores, marking a substantial contraction of 30.84% year-on-year, which reflects both seasonal headwinds and ongoing pressures within the sugar industry. Additionally, the net profit for the quarter was ₹9.24 crores, representing a decline of 16.46% compared to the same period last year. Despite these declines in revenue and profit, KM Sugar Mills demonstrated some resilience in margin management. The operating margin, excluding other income, improved to 18.65%, which is an increase from 15.42% in the prior year. This suggests that the company has been able to manage costs effectively, even as sales volumes have decreased. However, the profit after tax margin of 8.72% did decline from the previous quarter, indicating that while margins imp...
Read More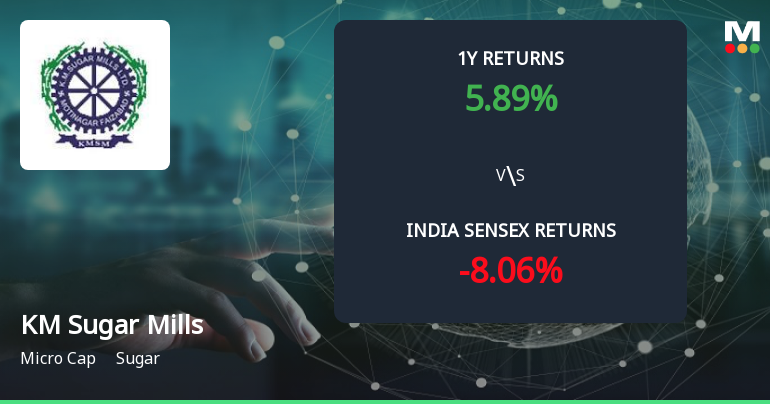
Golden Cross Confirmed: Do KM Sugar Mills Ltd's Other Technical Indicators Agree?
The 50-day moving average has crossed above the 200-day moving average for KM Sugar Mills Ltd, signalling a golden cross on 13 May 2026. While this technical event often suggests a shift towards bullish momentum, the broader technical and fundamental context presents a nuanced picture that merits closer examination.
Read More Announcements
Disclosures under Reg. 10(6) of SEBI (SAST) Regulations 2011
10-Jun-2026 | Source : BSEThe Exchange has received the disclosure under Regulation 10(6) of SEBI (Substantial Acquisition of Shares & Takeovers) Regulations 2011 for Naina Devi Jhunjhunwala
Disclosures under Reg. 29(2) of SEBI (SAST) Regulations 2011
09-Jun-2026 | Source : BSEThe Exchange has received the disclosure under Regulation 29(2) of SEBI (Substantial Acquisition of Shares & Takeovers) Regulations 2011 for L K Jhunjhunwala & PACs
Shareholder Meeting / Postal Ballot-Scrutinizers Report
30-May-2026 | Source : BSEScrutnizer Report on CCM of Unsecured Creditors
Corporate Actions

No Upcoming Board Meetings

KM Sugar Mills Ltd has declared 10% dividend, ex-date: 18 Aug 21

KM Sugar Mills Ltd has announced 2:10 stock split, ex-date: 26 Mar 10

No Bonus history available

No Rights history available
Quality key factors
Valuation key factors
Technicals key factors
 Technical Indicator Scale: Bearish, Mildly Bearish, Sideways, Mildly Bullish, Bullish Turned
 Shareholding Snapshot : Mar 2026
Shareholding Compare (%holding)
Promoters
None
Held by 0 Schemes
Held by 2 FIIs (0.19%)
Lakshmi Kant Jhunjhunwala (15.55%)
Umadevi Jhunjhunwala (2.65%)
38.81%
Quarterly Results Snapshot (Consolidated) - Mar'26 - YoY

YoY Growth in quarter ended Mar 2026 is -30.84% vs 24.67% in Mar 2025
YoY Growth in quarter ended Mar 2026 is -16.46% vs 44.39% in Mar 2025
Half Yearly Results Snapshot (Consolidated) - Sep'25

Growth in half year ended Sep 2025 is 12.74% vs -19.12% in Sep 2024
Growth in half year ended Sep 2025 is 99.07% vs -33.20% in Sep 2024
Nine Monthly Results Snapshot (Consolidated) - Dec'25
YoY Growth in nine months ended Dec 2025 is 9.22% vs -5.33% in Dec 2024
YoY Growth in nine months ended Dec 2025 is 80.40% vs 19.87% in Dec 2024
Annual Results Snapshot (Consolidated) - Mar'26
YoY Growth in year ended Mar 2026 is -0.10% vs 0.28% in Mar 2025
YoY Growth in year ended Mar 2026 is 50.27% vs 26.56% in Mar 2025
About KM Sugar Mills Ltd


