Dashboard
With HIgh Debt (Debt-Equity Ratio at 6.31 times)- the company has a Weak Long Term Fundamental Strength
- Low ability to service debt as the company has a high Debt to EBITDA ratio of 5.59 times
- The company has reported losses. Due to this company has reported negative ROE
Flat results in Dec 25
Stock is technically in a Mildly Bearish range
With ROCE of -0.5, it has a Very Expensive valuation with a 1.1 Enterprise value to Capital Employed
Consistent Underperformance against the benchmark over the last 3 years
Stock DNA
Non Banking Financial Company (NBFC)
INR 14 Cr (Micro Cap)
NA (Loss Making)
32
0.00%
6.31
-59.38%
3.18
Total Returns (Price + Dividend) 
Karnavati Financ for the last several years.
Risk Adjusted Returns v/s
Returns Beta

News
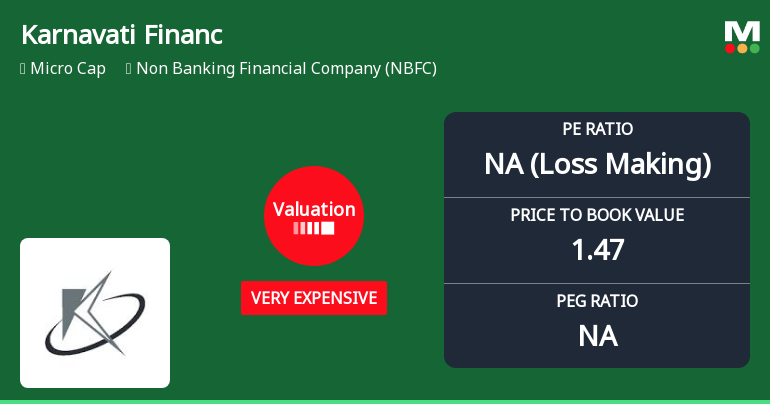
Karnavati Finance Ltd Valuation Shifts Signal Heightened Price Risk Amid Weak Fundamentals
Karnavati Finance Ltd, a micro-cap player in the Non Banking Financial Company (NBFC) sector, has seen its valuation parameters deteriorate sharply, with its price-to-earnings (P/E) and price-to-book value (P/BV) ratios moving into the 'very expensive' territory. Despite a recent uptick in share price, the company’s fundamentals remain weak, prompting a downgrade to a Strong Sell rating by MarketsMOJO as of 17 Jun 2025.
Read More Announcements
Compliances-Reg.24(A)-Annual Secretarial Compliance
30-May-2026 | Source : BSESubmission of Annual Secretarial Compliance Report
Audited Financial Results For The Quarter And Year Ended On 31.03.2026
29-May-2026 | Source : BSEAudited Financial Results for the quarter and year ended on 31.03.2026
Board Meeting Outcome for For Approval Of Audited Financial Results For The Quarter And Year Ended On March 31 2026
29-May-2026 | Source : BSESubmission of outcome of board meeting dated May 29 2026
Corporate Actions

No Upcoming Board Meetings

No Dividend history available

Karnavati Finance Ltd has announced 1:10 stock split, ex-date: 24 Feb 23

No Bonus history available

No Rights history available
Quality key factors
Valuation key factors
Technicals key factors
 Technical Indicator Scale: Bearish, Mildly Bearish, Sideways, Mildly Bullish, Bullish Turned
 Shareholding Snapshot : Mar 2026
Shareholding Compare (%holding)
Promoters
None
Held by 0 Schemes
Held by 0 FIIs
Raman P Morzaria (30.99%)
Theeta Trading Llp (3.73%)
29.71%
Quarterly Results Snapshot (Standalone) - Mar'26 - YoY

YoY Growth in quarter ended Mar 2026 is 900.00% vs -70.79% in Mar 2025

YoY Growth in quarter ended Mar 2026 is -557.95% vs -388.89% in Mar 2025
Half Yearly Results Snapshot (Standalone) - Sep'25
Growth in half year ended Sep 2025 is 575.56% vs -48.86% in Sep 2024
Growth in half year ended Sep 2025 is -538.36% vs -417.39% in Sep 2024
Nine Monthly Results Snapshot (Standalone) - Dec'25
YoY Growth in nine months ended Dec 2025 is 538.17% vs -39.07% in Dec 2024
YoY Growth in nine months ended Dec 2025 is -401.27% vs 46.98% in Dec 2024
Annual Results Snapshot (Standalone) - Mar'26
YoY Growth in year ended Mar 2026 is 238.22% vs -48.36% in Mar 2025
YoY Growth in year ended Mar 2026 is -251.19% vs -0.60% in Mar 2025
About Karnavati Finance Ltd


