Dashboard
High Debt company with Weak Long Term Fundamental Strength
- High Debt Company with a Debt to Equity ratio (avg) at 6.84 times
- The company has been able to generate a Return on Equity (avg) of 0.44% signifying low profitability per unit of shareholders funds
With ROCE of 0.6, it has a Expensive valuation with a 1.2 Enterprise value to Capital Employed
Total Returns (Price + Dividend) 
Kalpat. for the last several years.
Risk Adjusted Returns v/s
Returns Beta

News
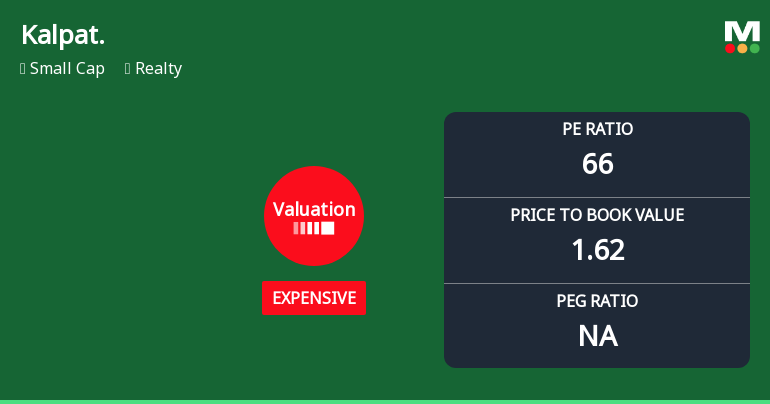
Kalpataru Ltd Valuation Shifts Signal Growing Price Pressure Amid Sector Challenges
Kalpataru Ltd, a small-cap player in the realty sector, has seen its valuation parameters shift notably towards the expensive territory, prompting a downgrade in its investment grade. With a current price of ₹322.45 and a recent day decline of 2.7%, the stock’s price-to-earnings (P/E) and price-to-book value (P/BV) ratios have moved beyond historical and peer averages, raising questions about its price attractiveness for investors.
Read MoreAre Kalpataru Ltd latest results good or bad?
Kalpataru Ltd's latest financial results for Q4 FY25 reflect a significant surge in both revenue and net profit, marking a notable turnaround compared to previous quarters. The company reported consolidated net sales of ₹1,693.73 crores, which represents a quarter-on-quarter growth of 235.45% and an impressive year-on-year increase of 183.76%. This surge is attributed to substantial project completions and revenue recognition typical for real estate developers in their final quarters. Net profit for the quarter stood at ₹200.47 crores, a stark contrast to the net loss of ₹62.78 crores in the previous quarter, indicating a strong operational execution during this period. Additionally, the operating margin improved significantly to 12.84%, recovering from negative margins in earlier quarters, which suggests better cost management and operational efficiency. However, while the headline figures are compelling...
Read More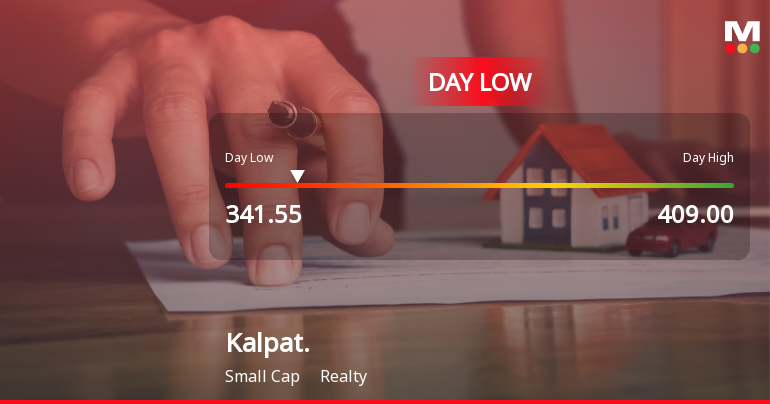
Kalpataru Ltd Hits Intraday Low Amid Price Pressure on 13 May 2026
Kalpataru Ltd experienced a significant intraday decline on 13 Jun 2026, touching a low of Rs 342.3, reflecting a sharp price pressure of -9.8% during the trading session. The stock underperformed its sector and broader market indices, continuing a three-day losing streak amid heightened volatility and mixed technical signals.
Read More Announcements
Intimation Under Regulation 30 Of SEBI LODR With Regard To Appeals Filed By Deputy Commissioner Of Income Tax With Income Tax Appellate Tribunal Against Agile Real Estate Pvt Ltd Subsidiary Of The Company
13-Jun-2026 | Source : BSEIntimation under Regulation 30 of SEBI LODR with regard to appeals filed by Deputy Commissioner of Income Tax with Income Tax Appellate Tribunal against Agile Real Estate Pvt Ltd subsidiary of the Company
Update On Scheme Of Arrangement
02-Jun-2026 | Source : BSEThis is to inform regarding withdrawal of Scheme of Arrangement for Demerged undertaking from Kalpataru Properties Limited (formerly known as Kalpataru Properties Private Limited) wholly owned subsidiary of the Company into the Company
Announcement under Regulation 30 (LODR)-Press Release / Media Release
25-May-2026 | Source : BSEPress release for signing of Cluster Redevelopment Project in Kandivali East
Corporate Actions

No Upcoming Board Meetings

No Dividend history available

No Splits history available

No Bonus history available

No Rights history available
Quality key factors
Valuation key factors
Technicals key factors
 Technical Indicator Scale: Bearish, Mildly Bearish, Sideways, Mildly Bullish, Bullish Turned
 Shareholding Snapshot : Mar 2026
Shareholding Compare (%holding)
Promoters
None
Held by 2 Schemes (5.29%)
Held by 5 FIIs (8.09%)
Mofatraj Pukhraj Munot (17.63%)
Sbi Multicap Fund (4.71%)
2.5%
Quarterly Results Snapshot (Consolidated) - Mar'26 - QoQ

QoQ Growth in quarter ended Mar 2026 is 235.45% vs -36.39% in Dec 2025
QoQ Growth in quarter ended Mar 2026 is 419.32% vs -1,254.04% in Dec 2025
Half Yearly Results Snapshot (Standalone) - Sep'25
Not Applicable: The company has declared_date for only one period
Not Applicable: The company has declared_date for only one period
Nine Monthly Results Snapshot (Standalone) - Dec'25
Not Applicable: The company has declared_date for only one period
Not Applicable: The company has declared_date for only one period
Annual Results Snapshot (Consolidated) - Mar'26
YoY Growth in year ended Mar 2026 is 54.40% vs 15.30% in Mar 2025
YoY Growth in year ended Mar 2026 is 333.44% vs 122.76% in Mar 2025
About Kalpataru Ltd

Company Coordinates