Dashboard
Weak Long Term Fundamental Strength with a 2.47% CAGR growth in Operating Profits over the last 5 years
- Company's ability to service its debt is weak with a poor EBIT to Interest (avg) ratio of 0.64
- The company has been able to generate a Return on Capital Employed (avg) of 7.15% signifying low profitability per unit of total capital (equity and debt)
Flat results in Mar 26
With ROE of 7.4, it has a Very Expensive valuation with a 2.3 Price to Book Value
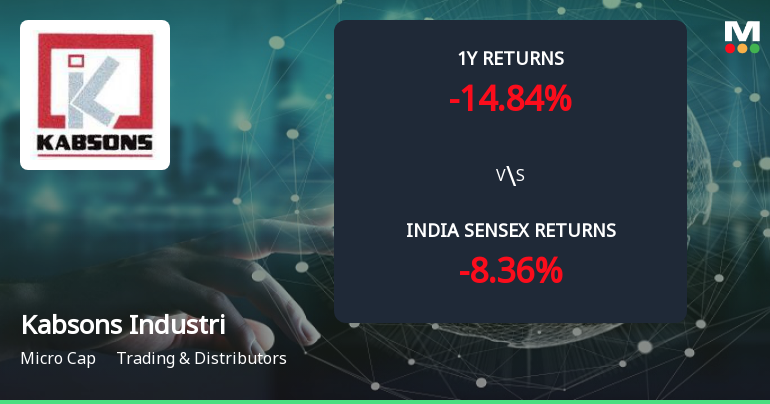
Underperformed the market in the last 1 year
Stock DNA
Trading & Distributors
INR 35 Cr (Micro Cap)
31.00
23
0.00%
-0.06
5.35%
2.28
Total Returns (Price + Dividend) 
Kabsons Industri for the last several years.
Risk Adjusted Returns v/s
Returns Beta

News
Kabsons Industries Ltd Forms Golden Cross Amid Mixed Technical Signals and Micro-Cap Challenges
The 50-day moving average for Kabsons Industries Ltd has crossed above the 200-day moving average, creating a golden cross on 19 May 2026. Yet, this technical milestone arrives amid a complex backdrop of conflicting momentum indicators and the inherent limitations of a micro-cap stock, raising questions about the signal’s reliability.
Read More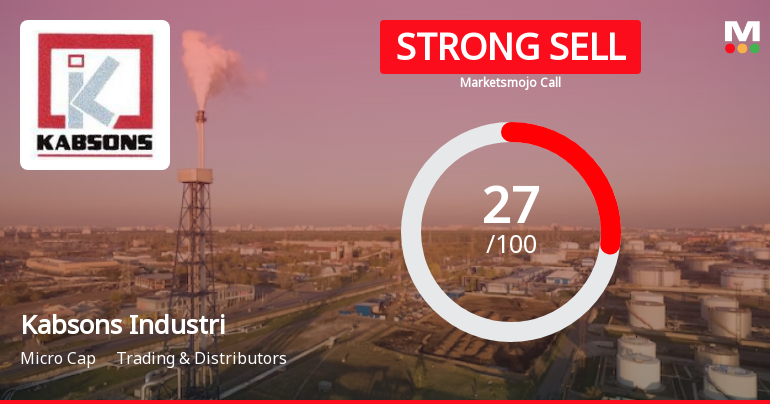
Kabsons Industries Ltd is Rated Strong Sell
Kabsons Industries Ltd is rated Strong Sell by MarketsMOJO. This rating was last updated on 13 Apr 2026, reflecting a shift from the previous 'Sell' grade. However, the analysis and financial metrics discussed here represent the stock's current position as of 13 May 2026, providing investors with the latest insights into its performance and outlook.
Read More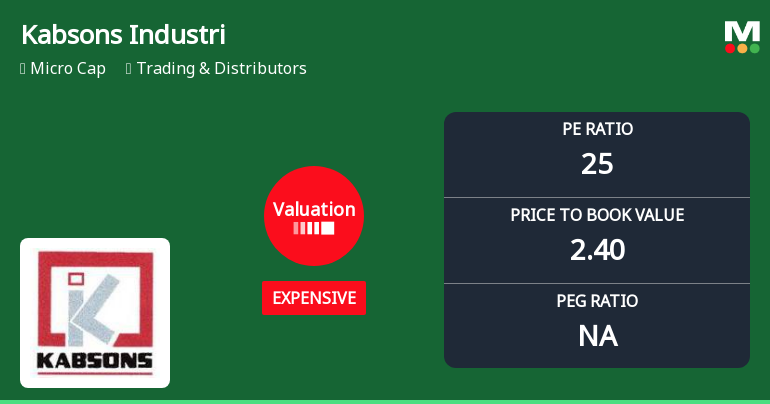
Kabsons Industries Ltd Valuation Shifts Amid Mixed Market Performance
Kabsons Industries Ltd, a micro-cap player in the Trading & Distributors sector, has experienced a notable shift in its valuation parameters, moving from a very expensive to an expensive rating. Despite a recent downgrade to a Strong Sell rating by MarketsMOJO, the stock’s price-to-earnings (P/E) and price-to-book value (P/BV) ratios remain elevated compared to peers, raising questions about its price attractiveness amid mixed returns and sector dynamics.
Read More Announcements
Announcement under Regulation 30 (LODR)-Newspaper Publication
30-May-2026 | Source : BSENewspaper Publication for audited financial results for the 4th quarter and year ended 31st March 2026
Approval Of Audited Financial Results For The Quarter And Year Ended 31St March 2026
29-May-2026 | Source : BSEApproval of audited financial results for the quarter and year ended 31st March 2026
Board Meeting Outcome for Approval Financial Results For The 4Th Quarter And Year Ended 31St March 2026.
29-May-2026 | Source : BSEApproval Financial Results for the 4th Quarter and year ended 31st March 2026.
Corporate Actions

No Upcoming Board Meetings

No Dividend history available

No Splits history available

No Bonus history available

No Rights history available
Quality key factors
Valuation key factors
Technicals key factors
 Technical Indicator Scale: Bearish, Mildly Bearish, Sideways, Mildly Bullish, Bullish Turned
 Shareholding Snapshot : Mar 2026
Shareholding Compare (%holding)
Promoters
None
Held by 0 Schemes
Held by 0 FIIs
Rajiv Kabra (52.22%)
Kabsons Gas Equipment Pvt (4.23%)
28.52%
Quarterly Results Snapshot (Standalone) - Mar'26 - QoQ

QoQ Growth in quarter ended Mar 2026 is 2.09% vs 3.97% in Dec 2025
QoQ Growth in quarter ended Mar 2026 is -205.08% vs 2,066.67% in Dec 2025
Half Yearly Results Snapshot (Standalone) - Sep'25
Growth in half year ended Sep 2025 is 10.56% vs 64.91% in Sep 2024
Growth in half year ended Sep 2025 is -60.77% vs 33.12% in Sep 2024
Nine Monthly Results Snapshot (Standalone) - Dec'25
YoY Growth in nine months ended Dec 2025 is 6.40% vs 68.44% in Dec 2024
YoY Growth in nine months ended Dec 2025 is -31.88% vs 17.61% in Dec 2024
Annual Results Snapshot (Standalone) - Mar'26
YoY Growth in year ended Mar 2026 is 7.45% vs 46.99% in Mar 2025
YoY Growth in year ended Mar 2026 is -61.17% vs -21.07% in Mar 2025
About Kabsons Industries Ltd


