Dashboard
Poor Management Efficiency with a low ROCE of 4.34%
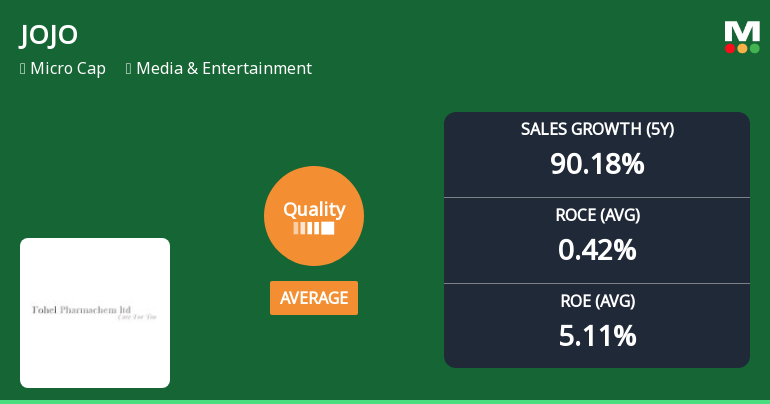
- The company has been able to generate a Return on Capital Employed (avg) of 4.34% signifying low profitability per unit of total capital (equity and debt)
Company has a low Debt to Equity ratio (avg) at 0.08 times
Healthy long term growth as Net Sales has grown by an annual rate of 90.18%
With a growth in Net Profit of 369.61%, the company declared Outstanding results in Dec 25
Technical trend is Sideways signifying no clear price momentum
With ROCE of 17.4, it has a Very Expensive valuation with a 15.1 Enterprise value to Capital Employed
Stock DNA
Media & Entertainment
INR 776 Cr (Micro Cap)
135.00
23
0.00%
0.08
3.42%
13.98
Total Returns (Price + Dividend) 
Latest dividend: 0 per share ex-dividend date: Sep-22-2025
Risk Adjusted Returns v/s
Returns Beta

News
JOJO Ltd Quality Grade Upgrade Signals Improved Business Fundamentals
JOJO Ltd, a micro-cap player in the Media & Entertainment sector, has seen its quality grade upgraded from below average to average, reflecting notable improvements in its business fundamentals. This upgrade, accompanied by a Mojo Score rise to 68.0 and a Hold rating, highlights the company’s enhanced financial health and operational consistency amid a challenging market backdrop.
Read MoreWhen is the next results date for JOJO Ltd?
The next results date for JOJO Ltd is scheduled for 15 May 2026....
Read More
JOJO Ltd is Rated Sell
JOJO Ltd is rated 'Sell' by MarketsMOJO, with this rating last updated on 13 Apr 2026. However, the analysis and financial metrics discussed here reflect the stock's current position as of 06 May 2026, providing investors with an up-to-date view of the company's fundamentals, valuation, financial trends, and technical outlook.
Read More Announcements
Integration Of JOJO App As A Bundled Offering On VZY Smart Tvs
16-Jun-2026 | Source : BSEIntegration of JOJO App as a Bundled Offering on VZY Smart TVs.
Board Meeting Outcome for Sub-Division Of The Face Value Of Each Equity Share Of The Company From Rs 10/- (Rupees Ten Only) Each To Rs 5/~ (Rupees Five Only) Each.
10-Jun-2026 | Source : BSESub-division of the face value of each Equity Share of the Company from Rs 10/- (Rupees Ten only) each to Rs 5/~ (Rupees Five only) each.
Revised Voting Results Along With Scrutinizers Report
08-Jun-2026 | Source : BSERevised voting results along with Scrutinizers Report
Corporate Actions

No Upcoming Board Meetings


No Splits history available

No Bonus history available

No Rights history available
Quality key factors
Valuation key factors
Technicals key factors
 Technical Indicator Scale: Bearish, Mildly Bearish, Sideways, Mildly Bullish, Bullish Turned
 Shareholding Snapshot : Mar 2026
Shareholding Compare (%holding)
Promoters
None
Held by 0 Schemes
Held by 0 FIIs
Dhruvin Daksheshbhai Shah (34.8%)
Jay Prakash Kariya (4.91%)
30.9%
Quarterly Results Snapshot (Consolidated) - Mar'26 - QoQ

QoQ Growth in quarter ended Mar 2026 is 54.60% vs 454.42% in Dec 2025

QoQ Growth in quarter ended Mar 2026 is 369.61% vs 229.03% in Dec 2025
Half Yearly Results Snapshot (Consolidated) - Sep'25
Growth in half year ended Sep 2025 is 379.41% vs 353.33% in Sep 2024
Growth in half year ended Sep 2025 is 92.62% vs -1,255.00% in Sep 2024
Nine Monthly Results Snapshot (Consolidated) - Dec'25
YoY Growth in nine months ended Dec 2025 is 285.47% vs 1,380.00% in Dec 2024
YoY Growth in nine months ended Dec 2025 is 147.67% vs -855.56% in Dec 2024
Annual Results Snapshot (Consolidated) - Mar'26
YoY Growth in year ended Mar 2026 is 446.92% vs -9.48% in Mar 2025
YoY Growth in year ended Mar 2026 is 438.55% vs -170.94% in Mar 2025
About JOJO Ltd


