Dashboard
With a Negative Book Value, the company has a Weak Long Term Fundamental Strength
- Poor long term growth as Net Sales has grown by an annual rate of 24.76% and Operating profit at 0% over the last 5 years
- High Debt Company with a Debt to Equity ratio (avg) at 0 times
Stock is technically in a Bearish range
Risky - Negative Book Value
Despite the size of the company, domestic mutual funds hold only 0.02% of the company
Stock DNA
Other Utilities
INR 766 Cr (Micro Cap)
NA (Loss Making)
36
0.00%
-6.63
12.42%
-1.49
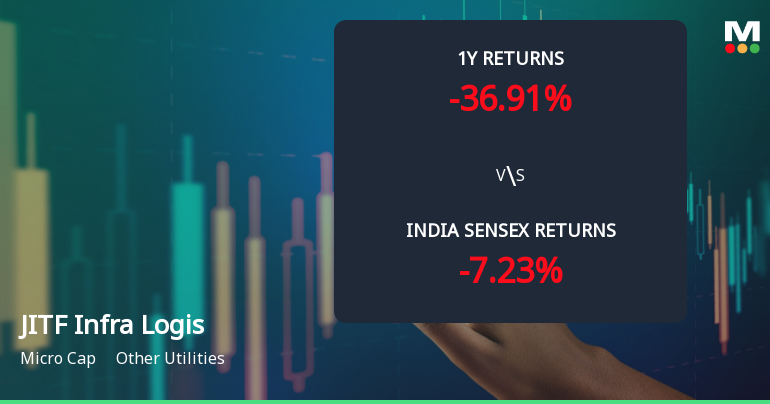
Total Returns (Price + Dividend) 
JITF Infra Logis for the last several years.
Risk Adjusted Returns v/s
Returns Beta

News
JITF Infra Logistics Ltd Faces Intensified Bearish Momentum Amid Technical Downgrade
JITF Infra Logistics Ltd has experienced a marked shift in its technical momentum, with key indicators signalling a deepening bearish trend. The stock’s recent price action, combined with deteriorating moving averages and negative MACD and Bollinger Bands readings, underscores growing downside risks for investors amid a challenging market backdrop.
Read More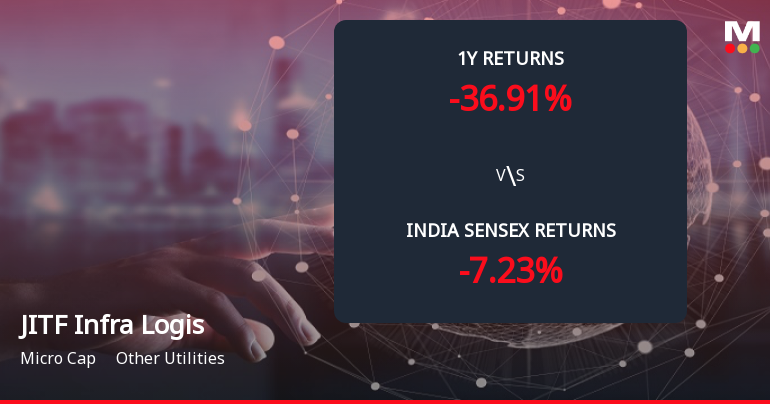
JITF Infra Logistics Ltd Forms Death Cross, Signalling Potential Bearish Trend
JITF Infra Logistics Ltd has recently formed a Death Cross, a significant technical indicator where the 50-day moving average crosses below the 200-day moving average. This development signals a potential shift towards a bearish trend, reflecting deteriorating momentum and raising concerns about the stock’s medium to long-term outlook.
Read MoreAre JITF Infra Logistics Ltd latest results good or bad?
JITF Infra Logistics Ltd reported its latest financial results for the quarter ending March 2026, showcasing a mix of operational growth and ongoing financial challenges. The company achieved net sales of ₹898.33 crores, reflecting a year-on-year growth of 14.07%, which indicates a continuation of its revenue momentum. This figure represents the highest quarterly revenue recorded by the company, suggesting operational capabilities in its infrastructure and logistics segments. However, despite the revenue growth, the company faced significant hurdles in profitability. The consolidated net loss for the quarter amounted to ₹17.83 crores, which is a substantial increase compared to the previous quarter's loss. This widening loss underscores the persistent issues related to high interest costs, which consumed a significant portion of the operating profit. The interest expenses for the quarter were ₹103.93 crore...
Read More Announcements
Audited Financial Results (Standalone & Consolidated) Of The Company For The Quarter/ Year Ended 31St March 2026 Along With The Audit Report
12-May-2026 | Source : BSEAS ATTACHED
Board Meeting Outcome for Audited Financial Results (Standalone & Consolidated) Of The Company For The Quarter/ Year Ended 31St March 2026 Along With The Audit Report
12-May-2026 | Source : BSEAS ATTACHED
Shareholder Meeting / Postal Ballot-Outcome of EGM
06-May-2026 | Source : BSEOUTCOME OF EGM
Corporate Actions

No Upcoming Board Meetings

No Dividend history available

No Splits history available

No Bonus history available

No Rights history available
Quality key factors
Valuation key factors
Technicals key factors
 Technical Indicator Scale: Bearish, Mildly Bearish, Sideways, Mildly Bullish, Bullish Turned
 Shareholding Snapshot : Mar 2026
Shareholding Compare (%holding)
Promoters
None
Held by 6 Schemes (0.01%)
Held by 16 FIIs (1.95%)
Nalwa Sons Investments Limited (16.75%)
Cresta Fund Ltd (1.66%)
31.6%
Quarterly Results Snapshot (Consolidated) - Mar'26 - YoY

YoY Growth in quarter ended Mar 2026 is 14.07% vs 20.59% in Mar 2025

YoY Growth in quarter ended Mar 2026 is 39.66% vs -190.76% in Mar 2025
Half Yearly Results Snapshot (Consolidated) - Sep'25
Growth in half year ended Sep 2025 is 15.03% vs -25.16% in Sep 2024
Growth in half year ended Sep 2025 is -115.88% vs 1,790.85% in Sep 2024
Nine Monthly Results Snapshot (Consolidated) - Dec'25
YoY Growth in nine months ended Dec 2025 is 29.27% vs -21.51% in Dec 2024
YoY Growth in nine months ended Dec 2025 is -117.32% vs 6,061.27% in Dec 2024
Annual Results Snapshot (Consolidated) - Mar'26
YoY Growth in year ended Mar 2026 is 23.98% vs -10.66% in Mar 2025
YoY Growth in year ended Mar 2026 is -191.85% vs 47.98% in Mar 2025
About JITF Infra Logistics Ltd


