Total Returns (Price + Dividend) 
Jinkushal Indus. for the last several years.
Risk Adjusted Returns v/s
Returns Beta

News

Jinkushal Industries Ltd is Rated Sell
Jinkushal Industries Ltd is rated Sell by MarketsMOJO, with this rating last updated on 27 Apr 2026. However, the analysis and financial metrics discussed below reflect the stock’s current position as of 20 May 2026, providing investors with the latest insights into the company’s fundamentals, returns, and overall outlook.
Read More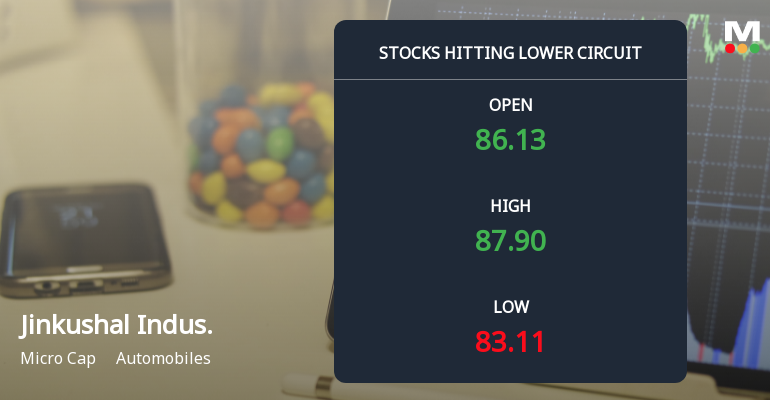
Below All Moving Averages and Now at Lower Circuit: Jinkushal Industries Ltd Loses 3.95% in a Single Session
At Rs 83.99, sellers were still queuing — but there were no buyers willing to take the other side. Jinkushal Industries Ltd locked at its lower circuit of 5% on 12 May 2026, with unfilled sell orders and a frozen price that capped losses at the maximum allowed daily decline.
Read More
Jinkushal Industries Ltd is Rated Sell
Jinkushal Industries Ltd is rated Sell by MarketsMOJO, with this rating last updated on 27 Apr 2026. While the rating was revised on that date, the analysis and financial metrics discussed here reflect the stock’s current position as of 09 May 2026, providing investors with the latest insights into the company’s performance and outlook.
Read More Announcements
Announcement under Regulation 30 (LODR)-Earnings Call Transcript
15-Jun-2026 | Source : BSETranscript of the Analyst / Instituional Investor Meet
Announcement under Regulation 30 (LODR)-Analyst / Investor Meet - Outcome
12-Jun-2026 | Source : BSEOutcome of Q4 FY26 Earnings Call
Announcement under Regulation 30 (LODR)-Investor Presentation
12-Jun-2026 | Source : BSESubmission of Investor Presentation on Financial Results for Q4 and FY 2025-26.
Corporate Actions

No Upcoming Board Meetings

No Dividend history available

No Splits history available

No Bonus history available

No Rights history available
Quality key factors
Valuation key factors
Technicals key factors
 Technical Indicator Scale: Bearish, Mildly Bearish, Sideways, Mildly Bullish, Bullish Turned
 Shareholding Snapshot : Mar 2026
Shareholding Compare (%holding)
Promoters
None
Held by 0 Schemes
Held by 7 FIIs (0.82%)
Anil Kumar Jain (41.78%)
Royal Alpha Opportunity Fund (1.71%)
13.7%
Quarterly Results Snapshot (Standalone) - Mar'26 - QoQ

QoQ Growth in quarter ended Mar 2026 is 46.59% vs 73.79% in Dec 2025
QoQ Growth in quarter ended Mar 2026 is -76.98% vs 17.46% in Dec 2025
Annual Results Snapshot (Standalone) - Mar'26

YoY Growth in year ended Mar 2026 is 47.92% vs -11.20% in Mar 2025
YoY Growth in year ended Mar 2026 is -22.64% vs -14.97% in Mar 2025


