Dashboard
High Management Efficiency with a high ROE of 18.05%
Company has a low Debt to Equity ratio (avg) at 0.02 times
Poor long term growth as Operating profit has grown by an annual rate 13.47% of over the last 5 years
Negative results in Mar 26
Stock is technically in a Bullish range
With ROE of 17.5, it has a Very Expensive valuation with a 8.5 Price to Book Value
High Institutional Holdings at 37.72%
Stock DNA
Pharmaceuticals & Biotechnology
INR 35,199 Cr (Small Cap)
48.00
34
1.31%
-0.15
18.88%
8.48
Total Returns (Price + Dividend) 
Latest dividend: 9.3 per share ex-dividend date: May-29-2026
Risk Adjusted Returns v/s
Returns Beta

News
Are J B Chemicals & Pharmaceuticals Ltd latest results good or bad?
J B Chemicals & Pharmaceuticals Ltd's latest financial results for Q4 FY26 reveal significant challenges, particularly in terms of profitability and sales performance. The company reported a net profit of ₹101.37 crore, which reflects a notable sequential decline of 48.77% from the previous quarter and a year-on-year decrease of 30.42%. This sharp drop in profit raises concerns about the sustainability of the company's earnings. Net sales for the same quarter amounted to ₹904.23 crore, marking a sequential decline of 15.07% from ₹1,064.72 crore in Q3 FY26 and a year-on-year decrease of 4.77%. This decline in revenue indicates potential cyclical and structural challenges within the business, as it represents the lowest quarterly revenue in FY26. The operating profit margin, excluding other income, contracted to 22.24%, down from 27.78% in the previous quarter, indicating significant margin compression. Thi...
Read More
J B Chemicals & Pharmaceuticals Ltd Technical Momentum Shifts to Bullish Amid Strong Price Gains
J B Chemicals & Pharmaceuticals Ltd has demonstrated a notable shift in price momentum, supported by a series of bullish technical indicators. The stock’s recent performance, coupled with upgrades in its technical trend and a revised Mojo Grade, signals renewed investor interest amid a challenging market backdrop.
Read More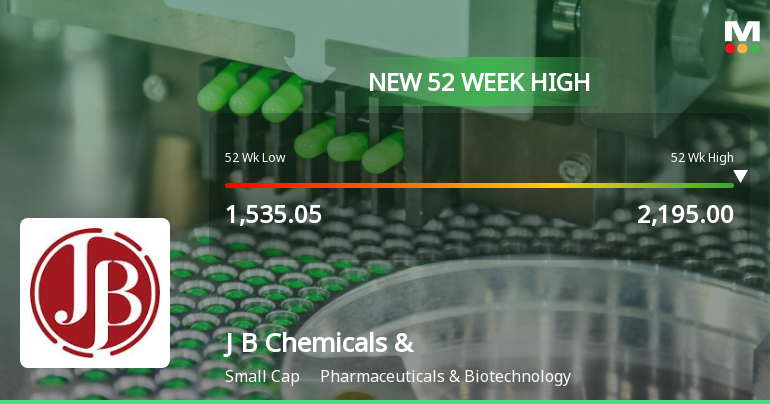
Broad-Based Technical Strength Lifts J B Chemicals & Pharmaceuticals Ltd to 52-Week High of Rs 2197
Surging to a fresh 52-week high of Rs 2197 on 11 May 2026, J B Chemicals & Pharmaceuticals Ltd has demonstrated robust price momentum, outperforming its sector and the broader market despite a declining Sensex. The stock’s six-day consecutive gain, delivering a 7.27% return in that span, underscores a sustained technical uptrend that has propelled it well above key moving averages.
Read More Announcements
Announcement under Regulation 30 (LODR)-Change in Management
15-Jun-2026 | Source : BSEIntimation dated June 12 2026 - Change in Senior Management Personnel
Announcement under Regulation 30 (LODR)-Change in Management
12-Jun-2026 | Source : BSEChange in Senior Management Personnel
Announcement under Regulation 30 (LODR)-Newspaper Publication
26-May-2026 | Source : BSENewspaper Advertisement
Corporate Actions

No Upcoming Board Meetings

J B Chemicals & Pharmaceuticals Ltd has declared 930% dividend, ex-date: 29 May 26

J B Chemicals & Pharmaceuticals Ltd has announced 1:2 stock split, ex-date: 18 Sep 23

No Bonus history available

No Rights history available
Quality key factors
Valuation key factors
Technicals key factors
 Technical Indicator Scale: Bearish, Mildly Bearish, Sideways, Mildly Bullish, Bullish Turned
 Shareholding Snapshot : Mar 2026
Shareholding Compare (%holding)
Promoters
None
Held by 36 Schemes (19.0%)
Held by 215 FIIs (16.33%)
Torrent Pharmaceuticals Limited (48.8%)
Kotak Midcap Fund (4.4%)
11.77%
Quarterly Results Snapshot (Consolidated) - Mar'26 - QoQ

QoQ Growth in quarter ended Mar 2026 is -15.07% vs -1.86% in Dec 2025
QoQ Growth in quarter ended Mar 2026 is -48.77% vs -4.78% in Dec 2025
Half Yearly Results Snapshot (Consolidated) - Sep'25
Growth in half year ended Sep 2025 is 8.67% vs 12.77% in Sep 2024
Growth in half year ended Sep 2025 is 16.73% vs 19.97% in Sep 2024
Nine Monthly Results Snapshot (Consolidated) - Dec'25
YoY Growth in nine months ended Dec 2025 is 9.27% vs 13.20% in Dec 2024
YoY Growth in nine months ended Dec 2025 is 18.33% vs 20.50% in Dec 2024
Annual Results Snapshot (Consolidated) - Mar'26
YoY Growth in year ended Mar 2026 is 5.87% vs 12.45% in Mar 2025
YoY Growth in year ended Mar 2026 is 7.56% vs 19.35% in Mar 2025
About J B Chemicals & Pharmaceuticals Ltd


