Dashboard
Low ability to service debt as the company has a high Debt to EBITDA ratio of 3.12 times
- Poor long term growth as Net Sales has grown by an annual rate of 12.48% over the last 5 years
- Low ability to service debt as the company has a high Debt to EBITDA ratio of 3.12 times
- The company has been able to generate a Return on Equity (avg) of 6.98% signifying low profitability per unit of shareholders funds
With a growth in Net Profit of 35.13%, the company declared Very Positive results in Mar 26
Stock is technically in a Mildly Bullish range
With ROCE of 13.1, it has a Expensive valuation with a 4.1 Enterprise value to Capital Employed
Stock DNA
Castings & Forgings
INR 644 Cr (Micro Cap)
53.00
47
0.08%
0.72
7.78%
6.27
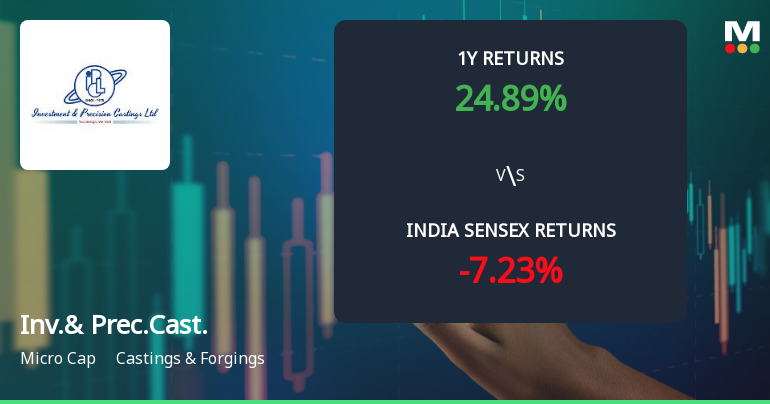
Total Returns (Price + Dividend) 
Latest dividend: 0.5 per share ex-dividend date: Sep-11-2025
Risk Adjusted Returns v/s
Returns Beta

News
Investment & Precision Castings Ltd Sees Bullish Momentum Amid Technical Upgrades
Investment & Precision Castings Ltd has demonstrated a notable shift in price momentum, supported by a series of bullish technical indicators. Despite a recent downgrade in its Mojo Grade from Buy to Hold, the micro-cap stock is exhibiting strong upward trends across multiple timeframes, signalling renewed investor interest and potential for further gains.
Read MoreAre Investment & Precision Castings Ltd latest results good or bad?
The latest financial results for Investment & Precision Castings Ltd for the quarter ended March 2026 indicate a notable operational performance. The company reported a net profit of ₹3.77 crores, reflecting a year-on-year growth of 98.42% and a quarter-on-quarter increase of 35.13%. This significant profit growth is complemented by a revenue of ₹51.17 crores, which shows an 8.04% increase from the previous quarter and a 20.37% rise compared to the same quarter last year. The operating margin for the quarter stood at 18.19%, representing an improvement of 376 basis points year-on-year, and the profit after tax (PAT) margin also saw an enhancement, reaching 7.45%, up by 292 basis points from the previous year. These metrics suggest that the company is effectively managing its costs and improving operational efficiency, particularly in a challenging manufacturing environment marked by raw material volatility...
Read More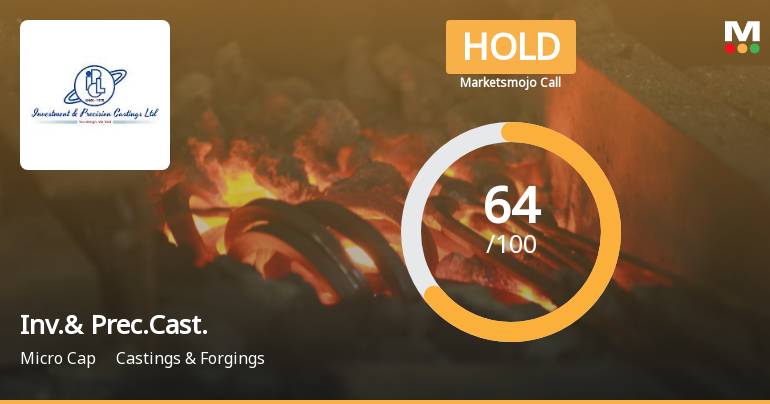
Investment & Precision Castings Ltd Downgraded to Hold Amid Mixed Technical and Financial Signals
Investment & Precision Castings Ltd, a micro-cap player in the Castings & Forgings sector, has seen its investment rating downgraded from Buy to Hold as of 18 May 2026. This adjustment reflects a nuanced reassessment across four key parameters: quality, valuation, financial trend, and technical indicators. While the company continues to demonstrate strong operational growth and impressive long-term returns, emerging concerns around debt servicing and technical momentum have tempered enthusiasm among analysts.
Read More Announcements
Compliances-Reg.24(A)-Annual Secretarial Compliance
29-May-2026 | Source : BSEAnnual secretarial Compliance report for Year ended 31st March 2026
Results For Q-4 F.Y. 2025-26
25-May-2026 | Source : BSEFinancial results for Meeting held as on 19.05.2026
Announcement under Regulation 30 (LODR)-Newspaper Publication
20-May-2026 | Source : BSENewspaper Publication of Financials for the F.Y. 2025-26
Corporate Actions

No Upcoming Board Meetings

Investment & Precision Castings Ltd has declared 5% dividend, ex-date: 11 Sep 25

No Splits history available

Investment & Precision Castings Ltd has announced 1:1 bonus issue, ex-date: 27 Jun 25

No Rights history available
Quality key factors
Valuation key factors
Technicals key factors
 Technical Indicator Scale: Bearish, Mildly Bearish, Sideways, Mildly Bullish, Bullish Turned
 Shareholding Snapshot : Mar 2026
Shareholding Compare (%holding)
Promoters
None
Held by 0 Schemes
Held by 0 FIIs
Meche Private Ltd (16.19%)
Rekha N Shah (10%)
40.39%
Quarterly Results Snapshot (Consolidated) - Mar'26 - QoQ

QoQ Growth in quarter ended Mar 2026 is 8.04% vs 5.17% in Dec 2025
QoQ Growth in quarter ended Mar 2026 is 35.13% vs -7.92% in Dec 2025
Half Yearly Results Snapshot (Consolidated) - Sep'25
Growth in half year ended Sep 2025 is 8.39% vs -8.94% in Sep 2024
Growth in half year ended Sep 2025 is 37.20% vs -34.54% in Sep 2024
Nine Monthly Results Snapshot (Consolidated) - Dec'25
YoY Growth in nine months ended Dec 2025 is 12.01% vs -6.60% in Dec 2024
YoY Growth in nine months ended Dec 2025 is 92.07% vs -41.41% in Dec 2024
Annual Results Snapshot (Consolidated) - Mar'26
YoY Growth in year ended Mar 2026 is 14.16% vs -3.44% in Mar 2025
YoY Growth in year ended Mar 2026 is 94.06% vs -22.21% in Mar 2025
About Investment & Precision Castings Ltd


