Dashboard
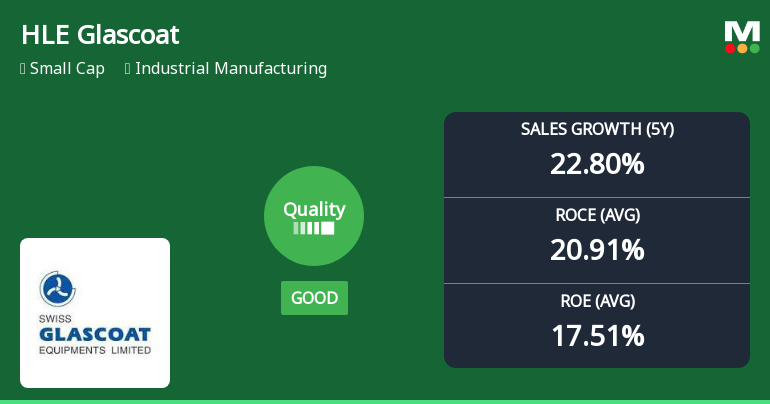
High Management Efficiency with a high ROCE of 15.84%
Poor long term growth as Operating profit has grown by an annual rate 4.52% of over the last 5 years
Positive results in Mar 26
Stock is technically in a Mildly Bearish range
With ROCE of 12.6, it has a Attractive valuation with a 3.1 Enterprise value to Capital Employed
Increasing Participation by Institutional Investors
Stock DNA
Industrial Manufacturing
INR 2,639 Cr (Small Cap)
50.00
38
0.28%
0.63
11.40%
5.00
Total Returns (Price + Dividend) 
Latest dividend: 1.1 per share ex-dividend date: Sep-19-2025
Risk Adjusted Returns v/s
Returns Beta

News
HLE Glascoat Ltd Upgrades Quality Grade Amid Mixed Financial Performance
HLE Glascoat Ltd has seen a notable upgrade in its quality grading from average to good, reflecting significant improvements in its core business fundamentals. This shift, accompanied by a Mojo Score rise to 58.0 and a grade change from Sell to Hold as of 09 Feb 2026, highlights enhanced operational efficiency, stronger returns, and better debt management within the industrial manufacturing sector.
Read MoreAre HLE Glascoat Ltd latest results good or bad?
HLE Glascoat Ltd's latest financial results for Q4 FY26 present a complex picture of operational performance. The company reported net sales of ₹391.69 crores, marking the highest quarterly sales in its recent history, with a sequential growth of 19.94% and a year-on-year increase of 17.37%. This topline strength indicates a robust recovery in sales compared to the previous quarter, which saw a decline. However, the consolidated net profit for the quarter was ₹18.19 crores, reflecting a significant sequential increase of 542.76% but a year-on-year decline of 10.57%. This juxtaposition highlights a recovery from a particularly low base in the preceding quarter, yet raises concerns about the sustainability of profitability given the year-on-year contraction. Operating margins, while showing a sequential improvement to 10.93%, have compressed significantly from the previous year, down 465 basis points from 1...
Read More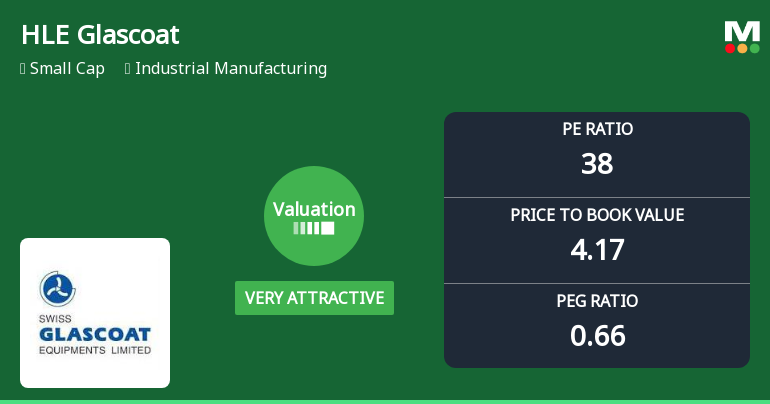
HLE Glascoat Ltd Valuation Shifts Signal Renewed Price Attractiveness Amid Market Challenges
HLE Glascoat Ltd, a small-cap player in the industrial manufacturing sector, has seen a notable shift in its valuation parameters, moving from an attractive to a very attractive rating. Despite recent share price declines, the company’s price-to-earnings (P/E) and price-to-book value (P/BV) ratios now present a compelling case for investors seeking value in a volatile market environment.
Read More Announcements
Announcement under Regulation 30 (LODR)-Earnings Call Transcript
01-Jun-2026 | Source : BSEEarnings Call Transcript for Q4 & year ended FY 2025-26.
Compliances-Reg.24(A)-Annual Secretarial Compliance
29-May-2026 | Source : BSEAnnual Secretarial Compliance report for the financial year 2025-26.
Announcement under Regulation 30 (LODR)-Meeting Updates
25-May-2026 | Source : BSEHLE Glascoat Limited has informed the Exchange about Link of Recording of the Earnings Call held on 25/05/2026 for the period ended on 31/03/2026.
Corporate Actions

No Upcoming Board Meetings

HLE Glascoat Ltd has declared 55% dividend, ex-date: 19 Sep 25

HLE Glascoat Ltd has announced 2:10 stock split, ex-date: 18 Oct 22

No Bonus history available

No Rights history available
Quality key factors
Valuation key factors
Technicals key factors
 Technical Indicator Scale: Bearish, Mildly Bearish, Sideways, Mildly Bullish, Bullish Turned
 Shareholding Snapshot : Mar 2026
Shareholding Compare (%holding)
Promoters
None
Held by 2 Schemes (3.46%)
Held by 13 FIIs (2.27%)
Nilesh Khushalbhai Patel (24.77%)
Overseas Pearl Ltd (3.58%)
19.46%
Quarterly Results Snapshot (Consolidated) - Mar'26 - QoQ

QoQ Growth in quarter ended Mar 2026 is 19.94% vs -6.90% in Dec 2025
QoQ Growth in quarter ended Mar 2026 is 542.76% vs -76.40% in Dec 2025
Half Yearly Results Snapshot (Consolidated) - Sep'25
Growth in half year ended Sep 2025 is 37.13% vs 9.78% in Sep 2024
Growth in half year ended Sep 2025 is 76.51% vs -16.72% in Sep 2024
Nine Monthly Results Snapshot (Consolidated) - Dec'25
YoY Growth in nine months ended Dec 2025 is 38.54% vs 5.00% in Dec 2024
YoY Growth in nine months ended Dec 2025 is 27.05% vs 10.13% in Dec 2024
Annual Results Snapshot (Consolidated) - Mar'26
YoY Growth in year ended Mar 2026 is 31.67% vs 6.16% in Mar 2025

YoY Growth in year ended Mar 2026 is 5.80% vs 57.33% in Mar 2025
About HLE Glascoat Ltd


