Dashboard
Low ability to service debt as the company has a high Debt to EBITDA ratio of 3.67 times
- Low ability to service debt as the company has a high Debt to EBITDA ratio of 3.67 times
- The company has been able to generate a Return on Capital Employed (avg) of 8.56% signifying low profitability per unit of total capital (equity and debt)
Poor long term growth as Operating profit has grown by an annual rate 4.14% of over the last 5 years
With ROCE of 12.4, it has a Very Expensive valuation with a 3.3 Enterprise value to Capital Employed
Despite the size of the company, domestic mutual funds hold only 0% of the company
Stock DNA
Pharmaceuticals & Biotechnology
INR 1,746 Cr (Small Cap)
32.00
34
0.34%
0.61
12.97%
4.84
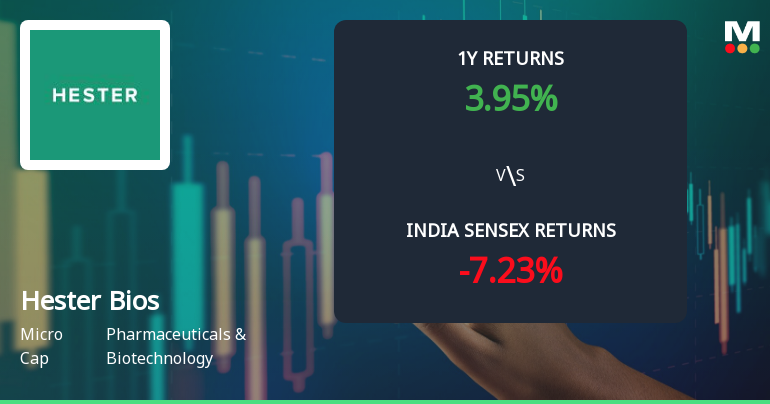
Total Returns (Price + Dividend) 
Latest dividend: 7 per share ex-dividend date: Aug-06-2025
Risk Adjusted Returns v/s
Returns Beta

News
Hester Biosciences Ltd Technical Momentum Shifts Amid Mixed Market Signals
Hester Biosciences Ltd has experienced a notable shift in its technical momentum, moving from a mildly bearish stance to a sideways trend, reflecting a complex interplay of bullish and bearish signals across key technical indicators. Despite a recent 2.40% gain in the stock price to ₹1,839.85, the company’s overall technical outlook remains mixed, with divergent signals from MACD, RSI, moving averages, and other momentum oscillators.
Read MoreAre Hester Biosciences Ltd latest results good or bad?
Hester Biosciences Ltd's latest financial results for Q4 FY26 indicate a notable operational turnaround compared to the previous year. The company reported a consolidated net profit of ₹15.98 crores, reflecting a significant year-on-year growth of 1,138.76%, a stark contrast to the near-zero profitability recorded in the same quarter last year. Additionally, revenue reached ₹100.11 crores, marking a year-on-year increase of 22.19% and surpassing previous quarterly records. The operating margin for this quarter stood at 34.29%, which is the highest in the company's history, showcasing substantial margin expansion driven by improved operational efficiencies and cost management. This margin represents a significant improvement from the prior year's figures, indicating a strong recovery in profitability. Sequentially, the results also demonstrate positive momentum, with net profit increasing by 82.21% from ₹8...
Read More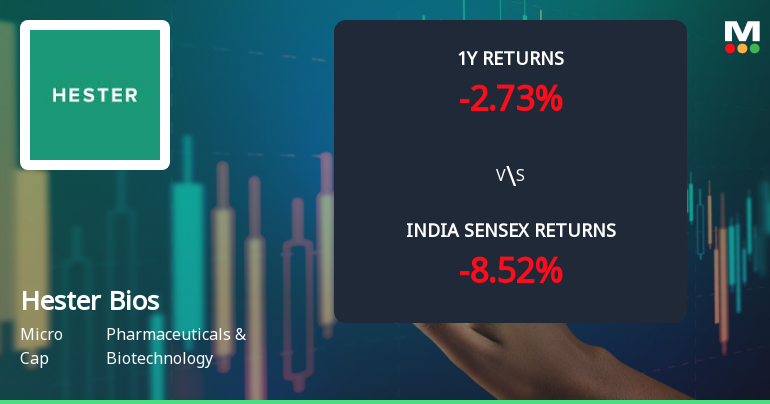
Hester Biosciences Ltd Sees Technical Momentum Shift Amid Mixed Market Signals
Hester Biosciences Ltd has experienced a notable shift in its technical momentum, moving from a mildly bullish to a mildly bearish trend as of mid-May 2026. Despite a recent downgrade in technical trend sentiment, the stock’s mixed signals across key indicators such as MACD, RSI, Bollinger Bands, and moving averages suggest a complex outlook for investors navigating the Pharmaceuticals & Biotechnology sector.
Read More Announcements
Announcement Under Regulation 30 Of Listing Regulations - Disclosure On Amendments In Loan Agreement Of Hester Africa
20-May-2026 | Source : BSEAnnouncement under Regulation 30 of Listing Regulation - Amendments in Loan agreement of Hester Africa
Intimation Of Submission Of The Reclassification Application Under Regulation 31A Of Listing Regulations
20-May-2026 | Source : BSEIntimation of Submission of reclassification application with the stock exchanges under Regulations 31A of Listing Regulations
Compliances-Reg.24(A)-Annual Secretarial Compliance
18-May-2026 | Source : BSEAnnual Secretarial Compliance Report for the year ended 31 March 2026
Corporate Actions

No Upcoming Board Meetings

Hester Biosciences Ltd has declared 70% dividend, ex-date: 06 Aug 25

No Splits history available

Hester Biosciences Ltd has announced 1:2 bonus issue, ex-date: 27 Sep 12

Hester Biosciences Ltd has announced 2:5 rights issue, ex-date: 29 May 06
Quality key factors
Valuation key factors
Technicals key factors
 Technical Indicator Scale: Bearish, Mildly Bearish, Sideways, Mildly Bullish, Bullish Turned
 Shareholding Snapshot : Mar 2026
Shareholding Compare (%holding)
Promoters
None
Held by 2 Schemes (0.0%)
Held by 15 FIIs (0.38%)
Rajiv Dinesh Gandhi (10.48%)
Kuntal Hasmukhlal Shah (3.17%)
33.29%
Quarterly Results Snapshot (Consolidated) - Mar'26 - YoY

YoY Growth in quarter ended Mar 2026 is 22.19% vs 3.37% in Mar 2025
YoY Growth in quarter ended Mar 2026 is 1,138.76% vs -73.94% in Mar 2025
Half Yearly Results Snapshot (Consolidated) - Sep'25

Growth in half year ended Sep 2025 is -6.56% vs 4.83% in Sep 2024
Growth in half year ended Sep 2025 is 112.45% vs 45.98% in Sep 2024
Nine Monthly Results Snapshot (Consolidated) - Dec'25
YoY Growth in nine months ended Dec 2025 is 1.44% vs 1.73% in Dec 2024
YoY Growth in nine months ended Dec 2025 is 51.37% vs 87.95% in Dec 2024
Annual Results Snapshot (Consolidated) - Mar'26
YoY Growth in year ended Mar 2026 is 6.91% vs 2.15% in Mar 2025
YoY Growth in year ended Mar 2026 is 102.40% vs 45.53% in Mar 2025
About Hester Biosciences Ltd


