Dashboard
High Debt company with Weak Long Term Fundamental Strength
- High Debt Company with a Debt to Equity ratio (avg) at 2.37 times
- The company has been able to generate a Return on Equity (avg) of 12.56% signifying low profitability per unit of shareholders funds
Negative results in Mar 26
Consistent Underperformance against the benchmark over the last 3 years
Stock DNA
Garments & Apparels
INR 40 Cr (Micro Cap)
14.00
24
0.00%
2.09
16.28%
2.10
Total Returns (Price + Dividend) 
Latest dividend: 1 per share ex-dividend date: Sep-20-2022
Risk Adjusted Returns v/s
Returns Beta

News
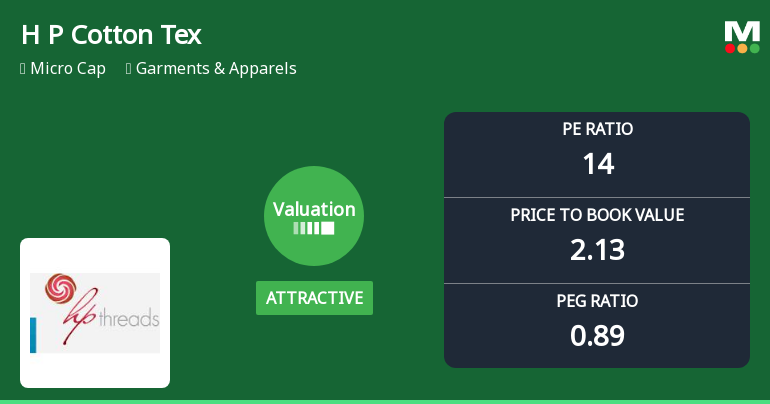
H P Cotton Textile Mills Ltd Valuation Shifts Signal Renewed Price Attractiveness
H P Cotton Textile Mills Ltd has witnessed a notable shift in its valuation parameters, moving from a very attractive to an attractive rating. This change reflects evolving market perceptions amid fluctuating price-to-earnings and price-to-book value ratios, prompting investors to reassess the stock’s price attractiveness within the Garments & Apparels sector.
Read MoreAre H P Cotton Textile Mills Ltd latest results good or bad?
H P Cotton Textile Mills Ltd's latest financial results for Q4 FY26 reflect significant challenges in its operational performance. The company reported a net profit of ₹0.68 crores, which represents a year-on-year decline of 30.61% from ₹0.98 crores in the same quarter last year. Although there was a modest sequential improvement of 4.62% from the previous quarter, the overall trend indicates a concerning reduction in profitability. Revenue for the quarter fell to ₹27.56 crores, marking a sharp year-on-year decline of 24.35% and a sequential drop of 17.93% from ₹33.58 crores in Q3 FY26. This decline in revenue is the lowest quarterly performance recorded in recent periods, highlighting weakening demand conditions in the textile sector. The operating margin also compressed to 8.35%, down from 9.91% year-on-year, indicating margin pressures despite efforts to manage costs. The company's financial performanc...
Read More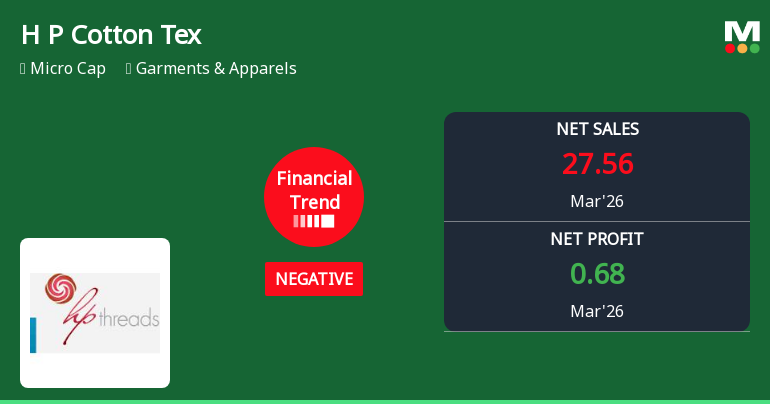
H P Cotton Textile Mills Ltd Reports Sharp Quarterly Decline Amid Negative Financial Trend
H P Cotton Textile Mills Ltd has reported a significant downturn in its financial performance for the quarter ended March 2026, marking a shift from a previously flat trend to a distinctly negative trajectory. Key metrics including net sales, operating profit, and pre-tax earnings have all contracted sharply, prompting a downgrade in the company’s mojo grade from Hold to Sell as of 13 May 2026.
Read More Announcements
Disclosures under Reg. 10(6) of SEBI (SAST) Regulations 2011
15-Jun-2026 | Source : BSEThe Exchange has received the disclosure under Regulation 10(6) of SEBI (Substantial Acquisition of Shares & Takeovers) Regulations 2011 for Kailash Agarwal
Disclosures under Reg. 29(2) of SEBI (SAST) Regulations 2011
15-Jun-2026 | Source : BSEThe Exchange has received the disclosure under Regulation 29(2) of SEBI (Substantial Acquisition of Shares & Takeovers) Regulations 2011 for Kailash Kumar Agarwal
Disclosures under Reg. 29(2) of SEBI (SAST) Regulations 2011
15-Jun-2026 | Source : BSEThe Exchange has received the disclosure under Regulation 29(2) of SEBI (Substantial Acquisition of Shares & Takeovers) Regulations 2011 for Ghanshyam Das Agarwal
Corporate Actions

No Upcoming Board Meetings

H P Cotton Textile Mills Ltd has declared 10% dividend, ex-date: 20 Sep 22

No Splits history available

No Bonus history available

No Rights history available
Quality key factors
Valuation key factors
Technicals key factors
 Technical Indicator Scale: Bearish, Mildly Bearish, Sideways, Mildly Bullish, Bullish Turned
 Shareholding Snapshot : Mar 2026
Shareholding Compare (%holding)
Promoters
None
Held by 0 Schemes
Held by 0 FIIs
Kailash Kumar Agarwal (30.19%)
Vinod Kumar Ohri (5.1%)
28.18%
Quarterly Results Snapshot (Consolidated) - Mar'26 - QoQ

QoQ Growth in quarter ended Mar 2026 is -17.93% vs -2.53% in Dec 2025

QoQ Growth in quarter ended Mar 2026 is 4.62% vs -17.72% in Dec 2025
Half Yearly Results Snapshot (Consolidated) - Sep'25
Growth in half year ended Sep 2025 is 19.15% vs 21.05% in Sep 2024
Growth in half year ended Sep 2025 is 26.15% vs -70.52% in Sep 2024
Nine Monthly Results Snapshot (Consolidated) - Dec'25
YoY Growth in nine months ended Dec 2025 is 13.35% vs 23.12% in Dec 2024
YoY Growth in nine months ended Dec 2025 is 44.03% vs -49.68% in Dec 2024
Annual Results Snapshot (Consolidated) - Mar'26
YoY Growth in year ended Mar 2026 is 2.63% vs 36.95% in Mar 2025
YoY Growth in year ended Mar 2026 is 15.56% vs 185.56% in Mar 2025
About H P Cotton Textile Mills Ltd


