Dashboard
With a Operating Losses, the company has a Weak Long Term Fundamental Strength
- Poor long term growth as Net Sales has grown by an annual rate of 3.15% and Operating profit at 12.89% over the last 5 years
- Company's ability to service its debt is weak with a poor EBIT to Interest (avg) ratio of -0.53
Stock is technically in a Mildly Bearish range
Risky - Negative Operating Profits
Total Returns (Price + Dividend) 
Guj. Petrosynth. for the last several years.
Risk Adjusted Returns v/s
Returns Beta

News
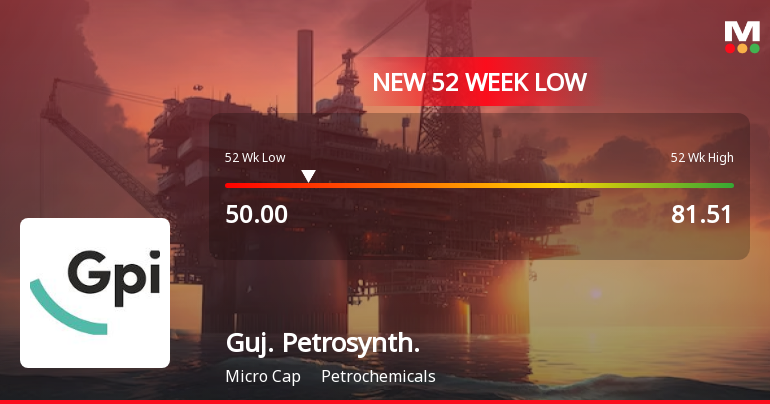
Five Consecutive Losses Push Gujarat Petrosynthese Ltd to a New 52-Week Low
For the fifth consecutive session, Gujarat Petrosynthese Ltd closed lower, slipping to a fresh 52-week low of Rs 50 on 21 May 2026. This decline comes amid a broader market rally, highlighting the stock's persistent underperformance relative to its sector and benchmark indices.
Read More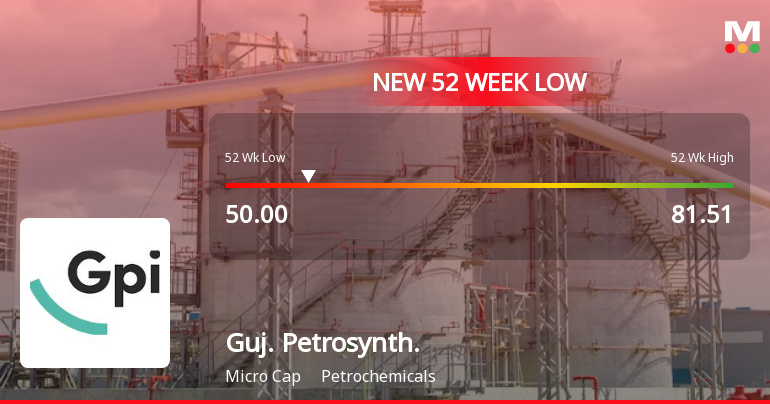
Five Consecutive Losses Push Gujarat Petrosynthese Ltd to a New 52-Week Low
For the fifth consecutive session, Gujarat Petrosynthese Ltd has closed lower, slipping to a fresh 52-week low of Rs 50 on 21 May 2026. This decline comes amid a broader market that is showing signs of resilience, with the Sensex trading higher by 0.4% on the day.
Read More
Gujarat Petrosynthese Ltd is Rated Strong Sell
Gujarat Petrosynthese Ltd is rated Strong Sell by MarketsMOJO, with this rating last updated on 17 Nov 2025. However, the analysis and financial metrics discussed here reflect the company’s current position as of 13 May 2026, providing investors with an up-to-date view of the stock’s fundamentals, valuation, financial trends, and technical outlook.
Read More Announcements
Board Meeting Intimation for For Considering And Approving The Audited Standalone Financial Results Along With Draft Audit Report Thereof For The Quarter And Financial Year Ended March 31 2026.
08-May-2026 | Source : BSEGujarat Petrosynthese Ltdhas informed BSE that the meeting of the Board of Directors of the Company is scheduled on 13/05/2026 inter alia to consider and approve the Audited Standalone Financial Results along with Draft Audit Report thereof for the quarter and financial year ended March 31 2026.
Compliances-Certificate under Reg. 74 (5) of SEBI (DP) Regulations 2018
15-Apr-2026 | Source : BSECertificate under Regulation 74(5) of the SEBI (Depositories and Participants) Regulations 2018 for the quarter ended March 31 2026
Closure of Trading Window
27-Mar-2026 | Source : BSEIntimation of Closure of Trading Window for the quarter ended March 31 2026.
Corporate Actions

No Upcoming Board Meetings

No Dividend history available

No Splits history available

No Bonus history available

No Rights history available
Quality key factors
Valuation key factors
Technicals key factors
 Technical Indicator Scale: Bearish, Mildly Bearish, Sideways, Mildly Bullish, Bullish Turned
 Shareholding Snapshot : Mar 2026
Shareholding Compare (%holding)
Promoters
None
Held by 4 Schemes (0.19%)
Held by 1 FIIs (1.01%)
Multichem Private Ltd (24.43%)
Life Insurance Corporation Of India (7.45%)
30.81%
Quarterly Results Snapshot (Standalone) - Mar'26 - QoQ

QoQ Growth in quarter ended Mar 2026 is -17.70% vs 71.53% in Dec 2025
QoQ Growth in quarter ended Mar 2026 is -57.43% vs 215.62% in Dec 2025
Half Yearly Results Snapshot (Standalone) - Sep'25

Growth in half year ended Sep 2025 is 15.69% vs 8.66% in Sep 2024
Growth in half year ended Sep 2025 is 113.95% vs -48.19% in Sep 2024
Nine Monthly Results Snapshot (Standalone) - Dec'25
YoY Growth in nine months ended Dec 2025 is 34.80% vs 15.49% in Dec 2024
YoY Growth in nine months ended Dec 2025 is 101.04% vs -36.84% in Dec 2024
Annual Results Snapshot (Standalone) - Mar'26
YoY Growth in year ended Mar 2026 is 33.45% vs 22.17% in Mar 2025
YoY Growth in year ended Mar 2026 is 61.64% vs -12.05% in Mar 2025
About Gujarat Petrosynthese Ltd


