Dashboard
Company has a low Debt to Equity ratio (avg) at 0.08 times
Healthy long term growth as Operating profit has grown by an annual rate 78.44%
Flat results in Mar 26
Technical trend is Sideways signifying no clear price momentum
With ROE of 23.3, it has a Expensive valuation with a 5.3 Price to Book Value
Majority shareholders : Promoters
Consistent Returns over the last 3 years
Stock DNA
Industrial Manufacturing
INR 386 Cr (Micro Cap)
27.00
37
0.12%
-0.06
26.71%
6.33
Total Returns (Price + Dividend) 
Latest dividend: 0.10000000000000002 per share ex-dividend date: Sep-22-2025
Risk Adjusted Returns v/s
Returns Beta

News
Are GTV Engineering Ltd latest results good or bad?
GTV Engineering Ltd's latest financial results for Q4 FY26 present a complex picture characterized by significant revenue growth alongside notable profitability challenges. The company reported net sales of ₹31.96 crores, reflecting a year-on-year growth of 42.74%, which marks a strong performance relative to the previous year. This achievement indicates the company's ability to scale operations effectively, achieving its highest quarterly revenue in the last twelve quarters. However, the profitability metrics reveal a contrasting trend. The net profit for the quarter was ₹3.11 crores, which represents a decline of 27.67% compared to the same quarter last year. This decline raises concerns about the sustainability of the company's profit margins, particularly as the operating margin fell sharply to 12.39%, down from 27.64% in the previous quarter. Such a significant compression of 1,525 basis points sugges...
Read More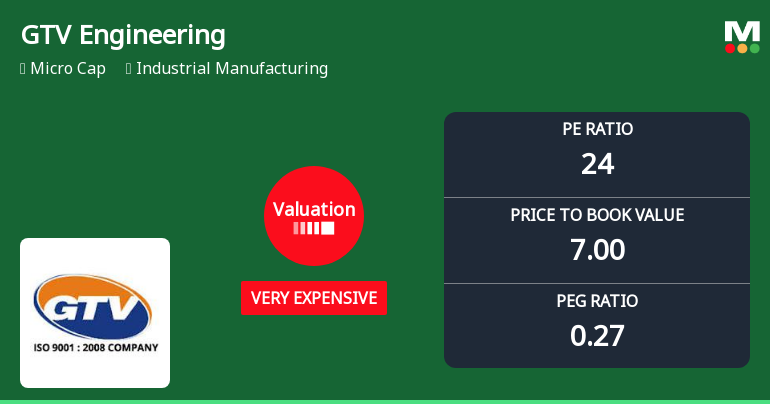
GTV Engineering Ltd Valuation Shifts Signal Changing Price Attractiveness
GTV Engineering Ltd has witnessed a notable shift in its valuation parameters, moving from an expensive to a very expensive rating, despite delivering robust returns that significantly outperform the broader market. This article analyses the recent changes in key valuation metrics such as the price-to-earnings (P/E) and price-to-book value (P/BV) ratios, placing them in context with historical trends and peer comparisons to assess the stock’s price attractiveness.
Read More
GTV Engineering Ltd is Rated Hold
GTV Engineering Ltd is rated 'Hold' by MarketsMOJO, a rating that was last updated on 01 Feb 2026. While this rating change occurred earlier this year, the analysis and financial metrics discussed here reflect the company’s current position as of 05 May 2026, providing investors with an up-to-date perspective on the stock’s fundamentals, valuation, financial trends, and technical outlook.
Read More Announcements
Update On Institutional Investors Meeting.
08-Jun-2026 | Source : BSEUpdate on Institutional Investors Meeting.
Board Meeting Outcome for Outcome Of Board Meeting For Allotment Of Equity Shares On Preferential Basis.
04-Jun-2026 | Source : BSEOutcome of Board Meeting for Allotment of Equity Shares on Preferential Basis for consideration other than cash.
Intimation Regarding Receipt Of In-Principal Approval For Preferential Issue Of Equity Shares On Share Swap Basis.
29-May-2026 | Source : BSEIntimation regarding receipt of In-Principal Approval for Preferential Issue of Equity Shares on Share Swap Basis.
Corporate Actions

No Upcoming Board Meetings

GTV Engineering Ltd has declared 5% dividend, ex-date: 22 Sep 25

GTV Engineering Ltd has announced 2:10 stock split, ex-date: 28 Jul 25

GTV Engineering Ltd has announced 2:1 bonus issue, ex-date: 28 Jul 25

No Rights history available
Quality key factors
Valuation key factors
Technicals key factors
 Technical Indicator Scale: Bearish, Mildly Bearish, Sideways, Mildly Bullish, Bullish Turned
 Shareholding Snapshot : Mar 2026
Shareholding Compare (%holding)
Promoters
None
Held by 0 Schemes
Held by 0 FIIs
Mahesh Agrawal (35.53%)
Rohit Dharampal Gupta (3.38%)
32.98%
Quarterly Results Snapshot (Standalone) - Mar'26 - YoY

YoY Growth in quarter ended Mar 2026 is 42.74% vs -30.18% in Mar 2025

YoY Growth in quarter ended Mar 2026 is -27.67% vs 84.55% in Mar 2025
Half Yearly Results Snapshot (Standalone) - Sep'25
Growth in half year ended Sep 2025 is -27.08% vs -11.42% in Sep 2024
Growth in half year ended Sep 2025 is 122.22% vs 82.61% in Sep 2024
Nine Monthly Results Snapshot (Standalone) - Dec'25
YoY Growth in nine months ended Dec 2025 is -13.46% vs -9.23% in Dec 2024
YoY Growth in nine months ended Dec 2025 is 64.59% vs 119.16% in Dec 2024
Annual Results Snapshot (Standalone) - Mar'26
YoY Growth in year ended Mar 2026 is -1.22% vs -14.80% in Mar 2025
YoY Growth in year ended Mar 2026 is 28.69% vs 104.25% in Mar 2025
About GTV Engineering Ltd


