Dashboard
Poor Management Efficiency with a low ROCE of 0.02%
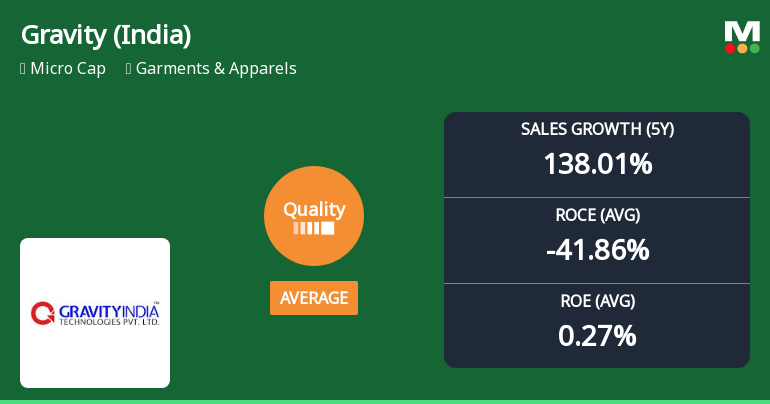
- The company has been able to generate a Return on Capital Employed (avg) of 0.02% signifying low profitability per unit of total capital (equity and debt)
Low ability to service debt as the company has a high Debt to EBITDA ratio of -1.00 times
Low Debt Company with Strong Long Term Fundamental Strength
With a growth in Net Sales of 66.76%, the company declared Very Positive results in Mar 26
Stock is technically in a Mildly Bullish range
Stock DNA
Garments & Apparels
INR 86 Cr (Micro Cap)
7.00
24
0.00%
1.24
75.24%
42.68
Total Returns (Price + Dividend) 
Gravity (India) for the last several years.
Risk Adjusted Returns v/s
Returns Beta

News
Gravity (India) Ltd Upgrades Quality Grade Amid Strong Financial Performance
Gravity (India) Ltd has seen a notable upgrade in its quality grading from below average to average, reflecting significant improvements in its business fundamentals. This micro-cap garment and apparel company has demonstrated robust sales and earnings growth over the past five years, alongside prudent debt management and improving returns, positioning it favourably within its sector.
Read MoreAre Gravity (India) Ltd latest results good or bad?
Gravity (India) Ltd has reported a significant operational revival in its latest quarterly results for Q4 FY26, with net sales reaching ₹99.24 crores, reflecting a quarter-on-quarter growth of 66.76% from ₹59.51 crores in Q3 FY26. This marks a notable recovery from the previous year when the company had negligible sales. The net profit for the quarter was ₹6.83 crores, which also shows a quarter-on-quarter increase of 51.78% compared to ₹4.50 crores in the prior quarter. Despite these positive revenue and profit figures, there are underlying concerns regarding the company's operational efficiency and capital structure. The operating margin for Q4 FY26 was recorded at 9.34%, which is a slight decline from 10.25% in Q3 FY26, indicating potential pressures from rising input costs or competitive pricing. Similarly, the PAT margin decreased to 6.88% from 7.56% in the previous quarter, suggesting that while reve...
Read More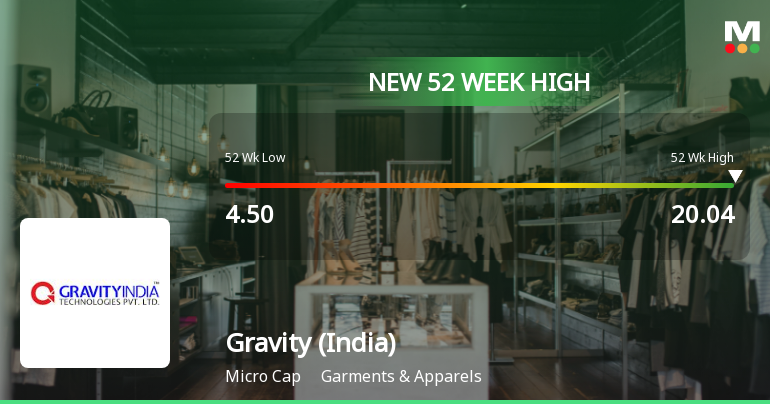
Broad-Based Technical Strength Lifts Gravity (India) Ltd to 52-Week High of Rs 20.04
With a remarkable 334.71% gain over the past year, Gravity (India) Ltd surged to a fresh 52-week high of Rs 20.04 on 12 May 2026, defying the broader market's downward trend. This rally is underpinned by a confluence of bullish technical indicators and sustained price momentum, marking a significant milestone for the micro-cap garment and apparel company.
Read More Announcements
Announcement under Regulation 30 (LODR)-Cessation
10-Jun-2026 | Source : BSEResignation of Independent Director.
Board Meeting Outcome for Outcome Of The Meeting Of The Rights Issue Committee
25-May-2026 | Source : BSEOutcome of the Meeting of the Rights Issue Committee of the Company held on 25th May 2026. The Company has not achieved the minimum subscription of 90% of the issue size as required under Regulation 86(2) of the SEBI (Issue of Capital and Disclosure Requirements) Regulations 2018 (SEBI ICDR Regulations). Hence the Company is under process to give instruction to RTA i.e. MUFG Intime India Private Limited for Refund / Unblocking of amount lying under the ASBA Account to those who have applied for this Rights Issue.
Board Meeting Outcome for Outcome Of Board Meeting Held On May 11 2026
11-May-2026 | Source : BSEAudited Financial Results for the period ended March 31 2026.
Corporate Actions

No Upcoming Board Meetings

No Dividend history available

No Splits history available

No Bonus history available

Gravity (India) Ltd has announced 23:3 rights issue, ex-date: 08 Apr 26
Quality key factors
Valuation key factors
Technicals key factors
 Technical Indicator Scale: Bearish, Mildly Bearish, Sideways, Mildly Bullish, Bullish Turned
 Shareholding Snapshot : Mar 2026
Shareholding Compare (%holding)
Non Institution
None
Held by 0 Schemes
Held by 0 FIIs
Varun Rasiklal Thakkar (5.99%)
Kshemtech Media Private Limited (7.78%)
62.14%
Quarterly Results Snapshot (Standalone) - Mar'26 - QoQ

QoQ Growth in quarter ended Mar 2026 is 66.76% vs 191.14% in Dec 2025
QoQ Growth in quarter ended Mar 2026 is 51.78% vs 210.34% in Dec 2025
Half Yearly Results Snapshot (Standalone) - Sep'25

Growth in half year ended Sep 2025 is 1,575.41% vs -24.22% in Sep 2024
Growth in half year ended Sep 2025 is 174.51% vs -325.00% in Sep 2024
Nine Monthly Results Snapshot (Standalone) - Dec'25
YoY Growth in nine months ended Dec 2025 is 6,453.28% vs -40.20% in Dec 2024
YoY Growth in nine months ended Dec 2025 is 452.05% vs 29.63% in Dec 2024
Annual Results Snapshot (Standalone) - Mar'26
YoY Growth in year ended Mar 2026 is 14,587.70% vs -45.78% in Mar 2025
YoY Growth in year ended Mar 2026 is 739.30% vs 67.37% in Mar 2025
About Gravity (India) Ltd


