Dashboard
With a Operating Losses, the company has a Weak Long Term Fundamental Strength
- Low ability to service debt as the company has a high Debt to EBITDA ratio of 7.04 times
- The company has been able to generate a Return on Equity (avg) of 3.63% signifying low profitability per unit of shareholders funds
Negative results in Mar 26
Stock is technically in a Mildly Bearish range
Underperformed the market in the last 1 year
Total Returns (Price + Dividend) 
Latest dividend: 0.6999999999999998 per share ex-dividend date: Aug-05-2014
Risk Adjusted Returns v/s
Returns Beta

News
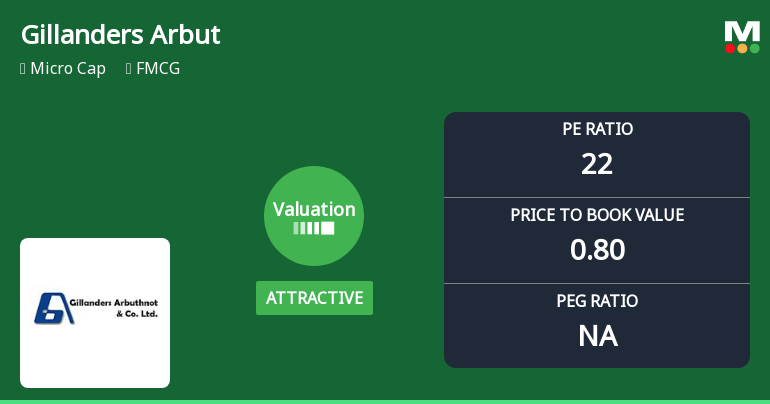
Gillanders Arbuthnot & Company Ltd: Valuation Shifts Signal Changing Price Attractiveness
Gillanders Arbuthnot & Company Ltd, a micro-cap player in the FMCG sector, has seen its valuation parameters shift from very attractive to attractive, reflecting a nuanced change in price attractiveness despite recent share price softness. With a current P/E ratio of 21.93 and a price-to-book value of 0.80, the stock’s valuation now invites a closer examination against its historical averages and peer group, especially amid a recent downgrade to a Strong Sell rating by MarketsMOJO.
Read MoreAre Gillanders Arbuthnot & Company Ltd latest results good or bad?
The latest financial results for Gillanders Arbuthnot & Company Ltd for Q4 FY26 indicate significant challenges across various operational metrics. The company reported a net loss of ₹3.89 crores, marking a substantial decline compared to the previous year, which raises concerns about its profitability. Revenue for the quarter was ₹103.39 crores, reflecting a slight year-on-year decrease of 0.53% and a sequential decline of 3.22%, suggesting weakening demand as the fiscal year concluded. Operating performance has notably deteriorated, with an operating margin of negative 4.22%, the lowest in seven quarters. This decline highlights ongoing difficulties in managing costs and maintaining pricing power within its core FMCG business. The operating profit before depreciation, interest, tax, and other income (PBDIT excluding OI) also turned negative at ₹4.36 crores, indicating severe operational challenges. The ...
Read More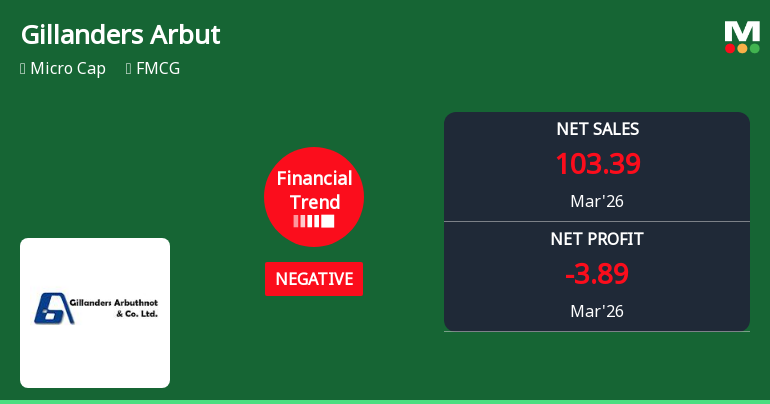
Gillanders Arbuthnot & Company Ltd Reports Sharp Quarterly Decline Amid Negative Financial Trend
Gillanders Arbuthnot & Company Ltd, a micro-cap player in the FMCG sector, has reported a significant deterioration in its financial performance for the quarter ended March 2026. The company’s financial trend has shifted from flat to negative, with key profitability metrics plunging sharply, raising concerns about its near-term outlook despite a mixed longer-term return profile relative to the Sensex.
Read More Announcements
Letters Dispatched The Shareholders
12-Jun-2026 | Source : BSEPursuant to Regulation 36(1)(b) of SEBI Listing Regulations2015 the Company has completed the dispatch of the letters containing the web-link of the Annual Report to those members whose email address(es) were not registered with the Company/Depository(ies).
Announcement under Regulation 30 (LODR)-Newspaper Publication
10-Jun-2026 | Source : BSENewspaper publication for the ensuing 92nd Annual General Meeting of the Company which is scheduled to be held on Friday 3rd July 2026 at 10:00 a.m. (IST).
Reg. 34 (1) Annual Report.
09-Jun-2026 | Source : BSEAnnual Report 2025-26
Corporate Actions

No Upcoming Board Meetings

Gillanders Arbuthnot & Company Ltd has declared 7% dividend, ex-date: 05 Aug 14

No Splits history available

Gillanders Arbuthnot & Company Ltd has announced 1:2 bonus issue, ex-date: 14 Sep 10

No Rights history available
Quality key factors
Valuation key factors
Technicals key factors
 Technical Indicator Scale: Bearish, Mildly Bearish, Sideways, Mildly Bullish, Bullish Turned
 Shareholding Snapshot : Mar 2026
Shareholding Compare (%holding)
Promoters
None
Held by 1 Schemes (0.0%)
Held by 0 FIIs
Kothari Investment And Industries Private Limited (34.32%)
Anil Jain (1.87%)
24.35%
Quarterly Results Snapshot (Consolidated) - Mar'26 - QoQ

QoQ Growth in quarter ended Mar 2026 is -3.22% vs -19.24% in Dec 2025

QoQ Growth in quarter ended Mar 2026 is -185.68% vs -68.16% in Dec 2025
Half Yearly Results Snapshot (Consolidated) - Sep'25
Growth in half year ended Sep 2025 is 4.28% vs 9.58% in Sep 2024
Growth in half year ended Sep 2025 is -24.38% vs 819.14% in Sep 2024
Nine Monthly Results Snapshot (Consolidated) - Dec'25
YoY Growth in nine months ended Dec 2025 is -3.47% vs 15.18% in Dec 2024
YoY Growth in nine months ended Dec 2025 is -45.91% vs 202.96% in Dec 2024
Annual Results Snapshot (Consolidated) - Mar'26
YoY Growth in year ended Mar 2026 is -2.78% vs 21.99% in Mar 2025
YoY Growth in year ended Mar 2026 is -64.56% vs 154.96% in Mar 2025
About Gillanders Arbuthnot & Company Ltd


