Dashboard
Company has a low Debt to Equity ratio (avg) at 0 times
Strong Long Term Fundamental Strength with an average Return on Equity (ROE) of 20.99%
With a growth in Operating Profit of 91.04%, the company declared Very Positive results in Mar 26
Stock is technically in a Mildly Bullish range
With ROE of 27, it has a Expensive valuation with a 3.5 Price to Book Value
Despite the size of the company, domestic mutual funds hold only 1.31% of the company
Stock DNA
Construction
INR 1,593 Cr (Small Cap)
13.00
35
0.00%
-0.04
22.24%
3.51
Total Returns (Price + Dividend) 
Latest dividend: 0 per share ex-dividend date: Feb-17-2025
Risk Adjusted Returns v/s
Returns Beta

News

Garuda Construction and Engineering Ltd Shows Mildly Bullish Momentum Amid Technical Shifts
Garuda Construction and Engineering Ltd has exhibited a notable shift in its technical momentum, transitioning from a sideways trend to a mildly bullish stance. Despite a modest daily gain of 1.15%, the stock’s technical indicators reveal a nuanced picture of price momentum and market sentiment, suggesting cautious optimism for investors in the construction sector.
Read MoreAre Garuda Construction and Engineering Ltd latest results good or bad?
Garuda Construction and Engineering Ltd's latest financial results for Q4 FY26 reflect a significant transformation in its operational performance. The company reported a net profit of ₹34.46 crore, marking a notable year-on-year growth of 91.13%. Revenue for the quarter reached ₹149.05 crore, which represents an 82.70% increase compared to the same period last year. This growth trajectory underscores the company's successful scaling from an annual revenue of ₹225 crore in FY25 to a rapidly expanding infrastructure player. The operating margin for the quarter stood at 32.18%, which is considered industry-leading, indicating strong operational efficiency and effective cost management. Additionally, the return on equity (ROE) was reported at 31.67%, showcasing exceptional capital efficiency and value creation for shareholders. However, the data also indicates a sequential moderation in growth. While revenue...
Read More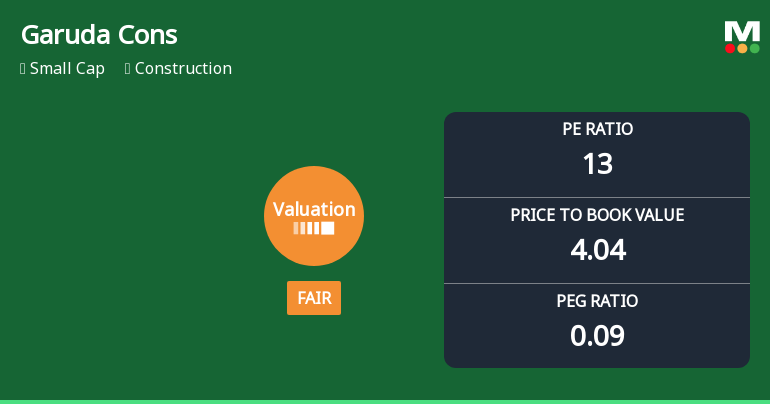
Garuda Construction and Engineering Ltd: Valuation Shift Signals Changing Market Sentiment
Garuda Construction and Engineering Ltd has witnessed a notable shift in its valuation parameters, moving from an expensive to a fair valuation grade amid a recent downgrade in its Mojo Grade from Buy to Hold. This change reflects evolving market perceptions as the stock trades at a price-to-earnings (P/E) ratio of 12.76 and a price-to-book value (P/BV) of 4.04, positioning it more attractively relative to its historical levels and peer group within the construction sector.
Read More Announcements
Announcement under Regulation 30 (LODR)-Change in Management
09-Jun-2026 | Source : BSEGaruda Construction and Engineering Limited has informed the Stock Exchange about the Change in Management of the Company.
Shareholder Meeting / Postal Ballot-Scrutinizers Report
08-Jun-2026 | Source : BSEResults of Postal Ballot pursuant to Regulation 44(3) of SEBI (Listing Obligations and Disclosure Requirements) Regulations 2015
Shareholder Meeting / Postal Ballot-Outcome of Postal_Ballot
08-Jun-2026 | Source : BSEOutcome of the Postal ballot is hereby enclosed
Corporate Actions

No Upcoming Board Meetings


No Splits history available

No Bonus history available

No Rights history available
Quality key factors
Valuation key factors
Technicals key factors
 Technical Indicator Scale: Bearish, Mildly Bearish, Sideways, Mildly Bullish, Bullish Turned
 Shareholding Snapshot : Mar 2026
Shareholding Compare (%holding)
Promoters
None
Held by 1 Schemes (0.42%)
Held by 10 FIIs (2.64%)
Pkh Ventures Limited (51.7%)
Yash Shares And Stock Private Limited (3.98%)
20.96%
Quarterly Results Snapshot (Standalone) - Mar'26 - QoQ

QoQ Growth in quarter ended Mar 2026 is 6.43% vs 20.26% in Dec 2025
QoQ Growth in quarter ended Mar 2026 is 4.40% vs 21.48% in Dec 2025
Half Yearly Results Snapshot (Standalone) - Sep'25

Growth in half year ended Sep 2025 is 195.08% vs 124.82% in Sep 2024
Growth in half year ended Sep 2025 is 191.95% vs 113.45% in Sep 2024
Nine Monthly Results Snapshot (Standalone) - Dec'25
YoY Growth in nine months ended Dec 2025 is 164.86% vs 53.43% in Dec 2024
YoY Growth in nine months ended Dec 2025 is 177.46% vs 39.97% in Dec 2024
Annual Results Snapshot (Standalone) - Mar'26
YoY Growth in year ended Mar 2026 is 135.84% vs 45.95% in Mar 2025
YoY Growth in year ended Mar 2026 is 146.06% vs 36.66% in Mar 2025
About Garuda Construction and Engineering Ltd

Company Coordinates