Dashboard
High Debt company with Weak Long Term Fundamental Strength
- Poor long term growth as Net Sales has grown by an annual rate of 7.39% over the last 5 years
- High Debt Company with a Debt to Equity ratio (avg) at 3.70 times
- The company has been able to generate a Return on Equity (avg) of 10.77% signifying low profitability per unit of shareholders funds
Stock is technically in a Mildly Bearish range
84.32% of Promoter Shares are Pledged
Underperformed the market in the last 1 year
Stock DNA
Diversified Commercial Services
INR 59 Cr (Micro Cap)
8.00
32
0.00%
1.50
0.16%
0.56
Total Returns (Price + Dividend) 
Future Market for the last several years.
Risk Adjusted Returns v/s
Returns Beta

News

Future Market Networks Ltd Locks at Lower Circuit With 4.96% Loss — Sellers Queue, No Buyers in Sight
At Rs 11.31, sellers were still queuing — but there were no buyers willing to take the other side. Future Market Networks Ltd locked at its lower circuit of 5% on 21 May 2026, with unfilled sell orders and a frozen price, signalling persistent selling pressure in a micro-cap stock with limited liquidity.
Read MoreAre Future Market Networks Ltd latest results good or bad?
Future Market Networks Ltd's latest financial results for the quarter ended March 2026 reveal a mixed operational performance. The company reported consolidated net sales of ₹25.43 crores, reflecting a sequential growth of 4.56% from ₹24.32 crores in the previous quarter. This marks the highest quarterly revenue in recent periods, with a year-on-year growth of 5.08%, indicating some stability in demand for its services. However, the consolidated net profit stood at ₹1.74 crores, which represents a decline of 10.77% from the previous quarter's profit of ₹1.95 crores. This decline in profitability is significant when contextualized against the company's historical performance, as it remains well below the profit levels seen prior to last year's exceptional loss event. The operating margin, excluding other income, was recorded at 44.55%, down from 48.23% in the previous quarter, suggesting challenges in maint...
Read More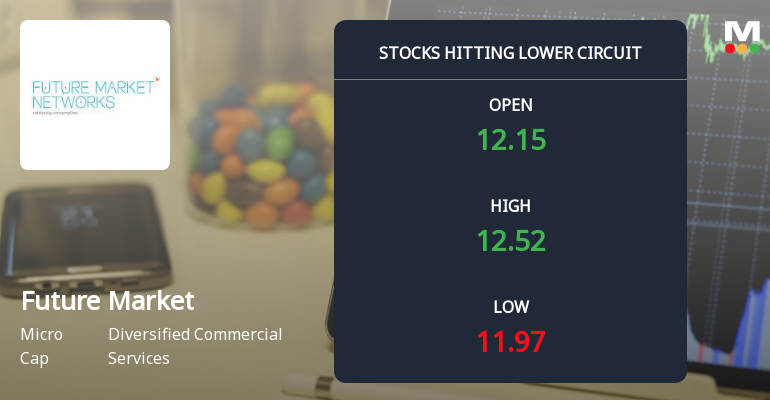
Future Market Networks Ltd Locks at Lower Circuit With 5.0% Loss — Sellers Queue, No Buyers in Sight
At Rs 11.90, sellers were still queuing — but there were no buyers willing to take the other side. Future Market Networks Ltd locked at its lower circuit of 5.0% on 20 May 2026, with unfilled sell orders and a frozen price.
Read More Announcements
Disclosures under Reg. 29(2) of SEBI (SAST) Regulations 2011
16-Jun-2026 | Source : BSEThe Exchange has received the disclosure under Regulation 29(2) of SEBI (Substantial Acquisition of Shares & Takeovers) Regulations 2011 for Surplus Finvest Pvt Ltd
Announcement under Regulation 30 (LODR)-Allotment
13-Jun-2026 | Source : BSEAllotment of 3118574 Equity Shares upon conversion of warrants to Surplus Finvest Private Limited
Announcement under Regulation 30 (LODR)-Newspaper Publication
09-Jun-2026 | Source : BSENewspaper advertisement regarding corrigendum to the Notice of extra ordinary general Meeting
Corporate Actions

No Upcoming Board Meetings

No Dividend history available

No Splits history available

No Bonus history available

No Rights history available
Quality key factors
Valuation key factors
Technicals key factors
 Technical Indicator Scale: Bearish, Mildly Bearish, Sideways, Mildly Bullish, Bullish Turned
 Shareholding Snapshot : Mar 2026
Shareholding Compare (%holding)
Promoters
84.3211
Held by 1 Schemes (0.0%)
Held by 0 FIIs
Future Corporate Resources Private Limited (58.67%)
Mable Rajesh (1.02%)
26.27%
Quarterly Results Snapshot (Consolidated) - Mar'26 - QoQ

QoQ Growth in quarter ended Mar 2026 is 4.56% vs -0.08% in Dec 2025
QoQ Growth in quarter ended Mar 2026 is -10.77% vs -27.51% in Dec 2025
Half Yearly Results Snapshot (Consolidated) - Sep'25

Growth in half year ended Sep 2025 is -3.84% vs 9.03% in Sep 2024
Growth in half year ended Sep 2025 is -95.25% vs 1,580.23% in Sep 2024
Nine Monthly Results Snapshot (Consolidated) - Dec'25
YoY Growth in nine months ended Dec 2025 is -4.82% vs 9.79% in Dec 2024
YoY Growth in nine months ended Dec 2025 is -93.53% vs 7,507.75% in Dec 2024
Annual Results Snapshot (Consolidated) - Mar'26
YoY Growth in year ended Mar 2026 is -2.44% vs 8.57% in Mar 2025
YoY Growth in year ended Mar 2026 is -88.01% vs 1,166.88% in Mar 2025
About Future Market Networks Ltd


