Dashboard
With a growth in Net Profit of 124.29%, the company declared Outstanding results in Dec 25
- OPERATING PROFIT TO NET SALES(Q) Highest at 18.68%
- PBT LESS OI(Q) At Rs 88.97 cr has Grown at 40.9% (vs previous 4Q average)
- PAT(Q) At Rs 67.31 cr has Grown at 40.0% (vs previous 4Q average)
Majority shareholders : Promoters
Stock DNA
Other Electrical Equipment
INR 9,698 Cr ()
32.00
60
0.00%
0.00
0.00%
7.76
Total Returns (Price + Dividend) 
Fujiyama Power for the last several years.
Risk Adjusted Returns v/s
Returns Beta

News

Fujiyama Power Systems Ltd Upgraded to Buy on Strong Financial and Quality Metrics
Fujiyama Power Systems Ltd has been upgraded to a Buy rating with a Mojo Score of 74.0, reflecting outstanding financial performance, excellent quality metrics, and a more attractive valuation profile. The company’s recent quarterly results and long-term fundamentals have driven this positive reassessment, positioning it favourably within the Other Electrical Equipment sector.
Read More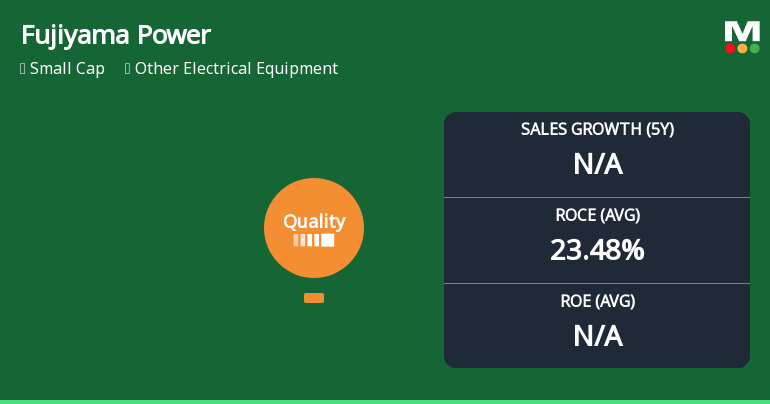
Fujiyama Power Systems Ltd Upgraded to Excellent Quality Grade Amid Strong Financial Metrics
Fujiyama Power Systems Ltd has been upgraded to an excellent quality grade, reflecting significant improvements in its business fundamentals. The company’s robust return on capital employed (ROCE), manageable debt levels, and consistent operational performance have contributed to this positive reassessment, positioning it favourably within the Other Electrical Equipment sector.
Read More Announcements
Compliances-Reg.24(A)-Annual Secretarial Compliance
30-May-2026 | Source : BSEAnnual Secretarial Compliance Report for the year ended 31st March 2026.
Announcement under Regulation 30 (LODR)-Press Release / Media Release
22-May-2026 | Source : BSEFujiyama Power Systems Limited has informed the Exchange regarding a Press Release dated May 22 2026 titled 1.2 GW TopCon Solar Cell manufacturing Facility at Ratlam Madhya Pradesh.
Announcement under Regulation 30 (LODR)-Earnings Call Transcript
22-May-2026 | Source : BSEFujiyama Power Systems Limited has informed the exchange about transcripts of the Investor Conference Call on audited financial results and limited reviewed quarterly financials results ended March 31 2026.
Corporate Actions

No Upcoming Board Meetings

No Dividend history available

No Splits history available

No Bonus history available

No Rights history available
Quality key factors
Valuation key factors
Technicals key factors
 Technical Indicator Scale: Bearish, Mildly Bearish, Sideways, Mildly Bullish, Bullish Turned
 Shareholding Snapshot : Mar 2026
Shareholding Compare (%holding)
Promoters
None
Held by 7 Schemes (2.93%)
Held by 14 FIIs (1.93%)
Yogesh Dua (33.73%)
Nippon Life India Trustee Ltd-a/c Nippon India Small Cap Fund (2.2%)
4.7%
Quarterly Results Snapshot (Standalone) - Dec'25 - QoQ

QoQ Growth in quarter ended Dec 2025 is 3.62% vs -4.93% in Sep 2025
QoQ Growth in quarter ended Dec 2025 is 7.01% vs -6.94% in Sep 2025
Annual Results Snapshot (Standalone) - Mar'25
Not Applicable: The company has declared_date for only one period
Not Applicable: The company has declared_date for only one period


