Dashboard
Healthy long term growth as Net Sales has grown by an annual rate of 38.09% and Operating profit at 58.31%
The company has declared Positive results for the last 7 consecutive quarters
Stock is technically in a Bullish range
With ROCE of 20.2, it has a Expensive valuation with a 4.8 Enterprise value to Capital Employed
Rising Promoter Confidence
Stock DNA
Pharmaceuticals & Biotechnology
INR 1,447 Cr (Micro Cap)
38.00
34
0.02%
1.03
18.34%
5.16
Total Returns (Price + Dividend) 
Latest dividend: 0.7 per share ex-dividend date: Sep-23-2025
Risk Adjusted Returns v/s
Returns Beta

News
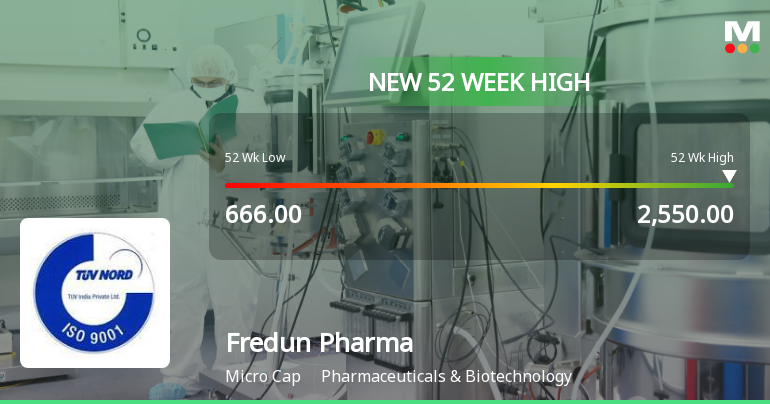
Broad-Based Technical Strength Lifts Fredun Pharmaceuticals Ltd to 52-Week High of Rs 2550
With a remarkable surge to Rs 2550 on 11 May 2026, Fredun Pharmaceuticals Ltd has reached a new 52-week and all-time high, marking a spectacular 264.41% gain over the past year. This milestone comes amid a backdrop of strong technical momentum and sustained earnings growth, setting the stage for a compelling price rally despite broader market headwinds.
Read More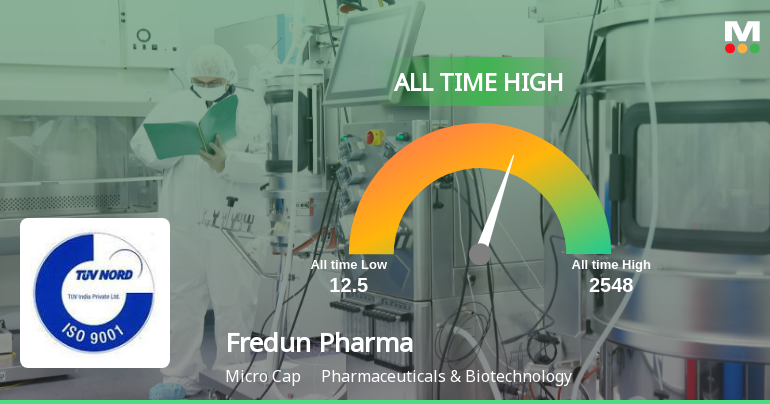
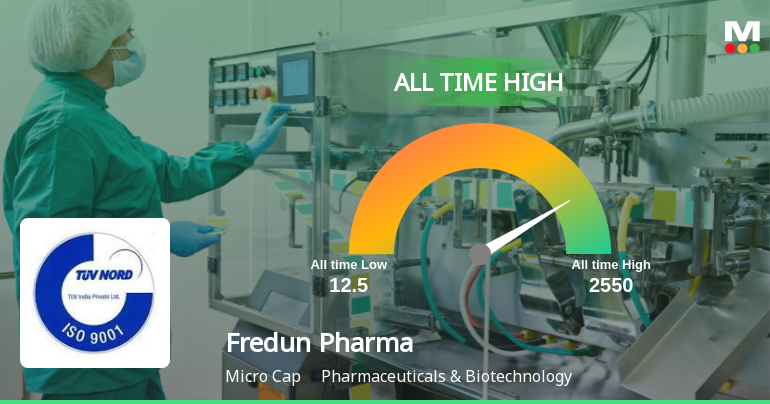
Strong Momentum Meets Stretched Valuations as Fredun Pharmaceuticals Ltd Reaches All-Time High
After a volatile session marked by an intraday swing of over 8%, Fredun Pharmaceuticals Ltd closed at a fresh all-time high of Rs 2,530 on 11 May 2026, extending its recent rally and outperforming the broader sector by nearly 4%. This milestone caps a remarkable run that has seen the stock surge over 265% in the past year, vastly outpacing the Sensex’s modest decline.
Read More Announcements
Announcement under Regulation 30 (LODR)-Earnings Call Transcript
12-Jun-2026 | Source : BSETranscript of the Earnings conference call held on 10th June 2026 for Q4 FY26.
Announcement under Regulation 30 (LODR)-Analyst / Investor Meet - Outcome
10-Jun-2026 | Source : BSEAudio Recording of the Q4 and year ended for the FY26 Earnings Conference Call
Announcement under Regulation 30 (LODR)-Newspaper Publication
09-Jun-2026 | Source : BSENewspaper Clipping- Information regarding 39th Annual General Meeting to be held on 30th June 2026 through video conference/other audio visual means.
Corporate Actions

No Upcoming Board Meetings

Fredun Pharmaceuticals Ltd has declared 7% dividend, ex-date: 23 Jun 26

No Splits history available

No Bonus history available

No Rights history available
Quality key factors
Valuation key factors
Technicals key factors
 Technical Indicator Scale: Bearish, Mildly Bearish, Sideways, Mildly Bullish, Bullish Turned
 Shareholding Snapshot : Mar 2026
Shareholding Compare (%holding)
Non Institution
None
Held by 0 Schemes
Held by 4 FIIs (1.06%)
Daulat Nariman Medhora (25.78%)
Nikhil Kishorchandra Vora (5.5%)
44.66%
Quarterly Results Snapshot (Standalone) - Mar'26 - YoY

YoY Growth in quarter ended Mar 2026 is 27.18% vs 41.15% in Mar 2025

YoY Growth in quarter ended Mar 2026 is 56.58% vs 39.72% in Mar 2025
Half Yearly Results Snapshot (Standalone) - Sep'25
Growth in half year ended Sep 2025 is 42.60% vs 29.23% in Sep 2024
Growth in half year ended Sep 2025 is 96.43% vs 32.49% in Sep 2024
Nine Monthly Results Snapshot (Standalone) - Dec'25
YoY Growth in nine months ended Dec 2025 is 47.73% vs 24.81% in Dec 2024
YoY Growth in nine months ended Dec 2025 is 96.50% vs 30.02% in Dec 2024
Annual Results Snapshot (Standalone) - Mar'26
YoY Growth in year ended Mar 2026 is 40.21% vs 30.33% in Mar 2025
YoY Growth in year ended Mar 2026 is 59.59% vs 33.23% in Mar 2025
About Fredun Pharmaceuticals Ltd


