Dashboard
Strong Long Term Fundamental Strength with a 24.72% CAGR growth in Operating Profits
Healthy long term growth as Net Sales has grown by an annual rate of 25.32% and Operating profit at 24.72%
The company has declared Positive results for the last 5 consecutive quarters
Stock is technically in a Mildly Bullish range
With ROE of 11.7, it has a Fair valuation with a 2.1 Price to Book Value
Majority shareholders : Promoters
Market Beating Performance
Stock DNA
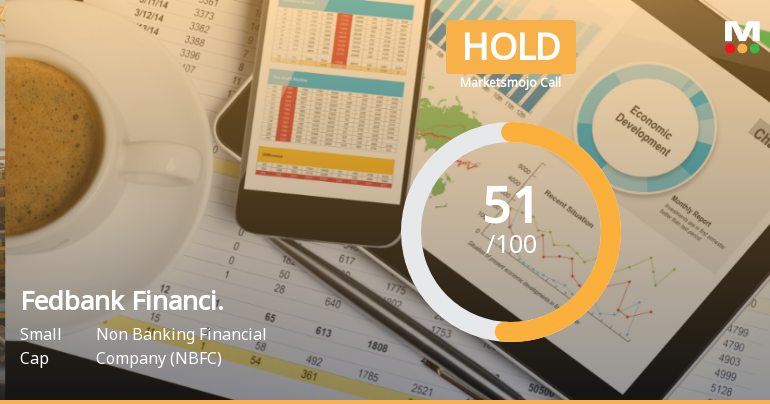
Non Banking Financial Company (NBFC)
INR 5,855 Cr (Small Cap)
18.00
21
0.00%
3.83
9.06%
2.06
Total Returns (Price + Dividend) 
Fedbank Financi. for the last several years.
Risk Adjusted Returns v/s
Returns Beta

News
Fedbank Financial Services Upgraded to Hold on Improved Technicals and Solid Fundamentals
Fedbank Financial Services Ltd has seen its investment rating upgraded from Sell to Hold, reflecting a notable improvement in technical indicators and sustained fundamental performance. The revision follows a comprehensive reassessment across quality, valuation, financial trends, and technical parameters, signalling a more balanced outlook for this small-cap NBFC amid a challenging market environment.
Read More
Fedbank Financial Services Ltd is Rated Hold
Fedbank Financial Services Ltd is rated 'Hold' by MarketsMOJO, with this rating last updated on 04 May 2026. However, the analysis and financial metrics discussed here reflect the stock's current position as of 10 May 2026, providing investors with an up-to-date view of its performance and outlook.
Read MoreAre Fedbank Financial Services Ltd latest results good or bad?
Fedbank Financial Services Ltd has reported its Q4 FY25 results, showcasing notable operational trends. The company achieved a net profit of ₹100.53 crores, reflecting a sequential increase of 14.36% from the previous quarter and a year-on-year growth of 40.32%. This growth trajectory is supported by a robust revenue performance, with net sales reaching ₹616.45 crores, which is an 11.04% increase from the preceding quarter and a 14.96% rise compared to the same quarter last year. The operating profit before depreciation, interest, and tax (PBDIT) reached ₹388.29 crores, marking a significant operational margin improvement to 62.99%, up from 61.19% in the previous quarter. The profit after tax (PAT) margin also expanded to 16.31%, indicating enhanced profitability. However, the company is grappling with a high debt-to-equity ratio of 4.67, which raises concerns about its leverage and financial stability. T...
Read More Announcements
Announcement under Regulation 30 (LODR)-Analyst / Investor Meet - Intimation
16-Jun-2026 | Source : BSEIntimation of the Investor Meeting to be held on June 23 2026
Announcement under Regulation 30 (LODR)-Analyst / Investor Meet - Intimation
12-Jun-2026 | Source : BSEIntimation of Investor Meeting held on June 12 2026
Announcement under Regulation 30 (LODR)-Analyst / Investor Meet - Intimation
11-Jun-2026 | Source : BSEIntimation of the Investor meeting held today i.e. June 11 2026
Corporate Actions

No Upcoming Board Meetings

No Dividend history available

No Splits history available

No Bonus history available

No Rights history available
Quality key factors
Valuation key factors
Technicals key factors
 Technical Indicator Scale: Bearish, Mildly Bearish, Sideways, Mildly Bullish, Bullish Turned
 Shareholding Snapshot : Mar 2026
Shareholding Compare (%holding)
Promoters
None
Held by 9 Schemes (2.71%)
Held by 30 FIIs (0.66%)
Financial Institutions / Banks (60.79%)
True North Fund Vi Llp (7.26%)
15.53%
Quarterly Results Snapshot (Standalone) - Mar'26 - QoQ

QoQ Growth in quarter ended Mar 2026 is 11.04% vs 3.70% in Dec 2025
QoQ Growth in quarter ended Mar 2026 is 14.36% vs 9.68% in Dec 2025
Half Yearly Results Snapshot (Standalone) - Sep'25

Growth in half year ended Sep 2025 is 6.23% vs 30.96% in Sep 2024
Growth in half year ended Sep 2025 is 15.12% vs 20.73% in Sep 2024
Nine Monthly Results Snapshot (Standalone) - Dec'25
YoY Growth in nine months ended Dec 2025 is 5.71% vs 29.98% in Dec 2024
YoY Growth in nine months ended Dec 2025 is 58.31% vs -13.27% in Dec 2024
Annual Results Snapshot (Standalone) - Mar'26
YoY Growth in year ended Mar 2026 is 7.84% vs 30.73% in Mar 2025
YoY Growth in year ended Mar 2026 is 52.59% vs -7.98% in Mar 2025
About Fedbank Financial Services Ltd

Company Coordinates