Dashboard
- PBT LESS OI(Q) At Rs 20.18 cr has Grown at 255.0% (vs previous 4Q average)
- PAT(Q) At Rs 22.06 cr has Grown at 197.9% (vs previous 4Q average)
- NET SALES(Q) Highest at Rs 158.52 cr
With ROE of 13.1, it has a Attractive valuation with a 4.1 Price to Book Value
Despite the size of the company, domestic mutual funds hold only 0% of the company
Total Returns (Price + Dividend) 
Fabtech Tech. for the last several years.
Risk Adjusted Returns v/s
Returns Beta

News
Fabtech Technologies Ltd Upgraded to Hold on Improved Technicals and Attractive Valuation
Fabtech Technologies Ltd, a micro-cap player in the industrial manufacturing sector, has seen its investment rating upgraded from Sell to Hold as of 18 May 2026. This change reflects improvements across key parameters including valuation attractiveness and technical trends, despite ongoing challenges in stock price performance relative to the broader market.
Read More
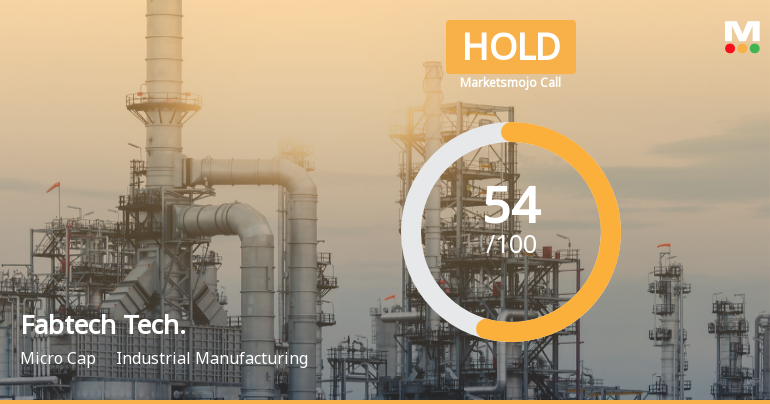
Fabtech Technologies Ltd is Rated Hold
Fabtech Technologies Ltd is rated 'Hold' by MarketsMOJO, with this rating last updated on 28 Apr 2026. However, the analysis and financial metrics discussed here reflect the stock's current position as of 10 May 2026, providing investors with the latest insights into the company’s performance and outlook.
Read MoreAre Fabtech Technologies Ltd latest results good or bad?
Fabtech Technologies Ltd has reported its financial results for Q4 FY26, showcasing significant volatility in its performance. The company achieved a net profit of ₹22.06 crores, which represents a substantial quarter-on-quarter increase from a loss in the previous quarter, while revenue surged to ₹158.52 crores, marking the highest quarterly revenue in its recent history. This revenue growth of 152.58% from the prior quarter follows a pattern of extreme fluctuations, as the company had previously experienced considerable losses in Q3 FY26 and Q2 FY26. The operating margin for Q4 FY26 stood at 14.01%, a recovery from the negative margin of -18.26% in Q3 FY26. Year-on-year comparisons also show positive trends, with a 46.19% increase in net profit and a 17.54% rise in revenue compared to Q4 FY25. However, the company's reliance on other income, which constituted 30.41% of its operating profit, raises questi...
Read More Announcements
Announcement under Regulation 30 (LODR)-Award_of_Order_Receipt_of_Order
15-Jun-2026 | Source : BSEIntimation of Order/ Contract
Announcement under Regulation 30 (LODR)-Press Release / Media Release
15-Jun-2026 | Source : BSEPlease find attached Press Release
Acqusition Of To Be Incorporated Company
02-Jun-2026 | Source : BSEFabtech Technologies Limited has informed the Exchange about Acquisition of to be incorporated Company
Corporate Actions

No Upcoming Board Meetings

No Dividend history available

No Splits history available

No Bonus history available

No Rights history available
Quality key factors
Valuation key factors
Technicals key factors
 Technical Indicator Scale: Bearish, Mildly Bearish, Sideways, Mildly Bullish, Bullish Turned
 Shareholding Snapshot : Mar 2026
Shareholding Compare (%holding)
Promoters
None
Held by 2 Schemes (0.0%)
Held by 4 FIIs (0.08%)
Aasif Ahsan Khan (41.52%)
Keya Vimal Salot (1.75%)
21.71%
Quarterly Results Snapshot (Standalone) - Dec'25 - QoQ

QoQ Growth in quarter ended Dec 2025 is -41.47% vs 25.36% in Sep 2025
QoQ Growth in quarter ended Dec 2025 is -93.03% vs 253.39% in Sep 2025
Annual Results Snapshot (Standalone) - Mar'25

YoY Growth in year ended Mar 2025 is 21.99% vs -24.64% in Mar 2023
YoY Growth in year ended Mar 2025 is 104.91% vs -17.23% in Mar 2023


