Dashboard
Poor Management Efficiency with a low ROE of 2.96%
- The company has been able to generate a Return on Equity (avg) of 2.96% signifying low profitability per unit of shareholders funds
Flat results in Mar 26
Stock is technically in a Mildly Bearish range
53.66% of Promoter Shares are Pledged
Below par performance in long term as well as near term
Stock DNA
Electronics & Appliances
INR 8,839 Cr (Small Cap)
47.00
53
0.00%
-0.05
4.10%
1.97
Total Returns (Price + Dividend) 
Eureka Forbes for the last several years.
Risk Adjusted Returns v/s
Returns Beta

News
Are Eureka Forbes Ltd latest results good or bad?
Eureka Forbes Ltd reported its financial results for Q4 FY26, showcasing a significant quarter-on-quarter recovery in net profit, which reached ₹51.03 crore, a notable change from the previous quarter. This recovery was largely attributed to a rebound from an exceptionally weak Q3 FY26, where net profit had experienced a substantial decline. However, when viewed year-on-year, the profit growth was modest at just 3.09%, which raises concerns given that revenue growth was more robust at 11.60%. The company's revenue for Q4 FY26 stood at ₹683.72 crore, reflecting a 5.94% increase from the previous quarter and an 11.60% rise compared to the same quarter last year. This sustained revenue growth indicates the company's ability to capture market share within the competitive home appliances sector, particularly in water purification and vacuum cleaning systems. Despite the positive revenue figures, the operating ...
Read More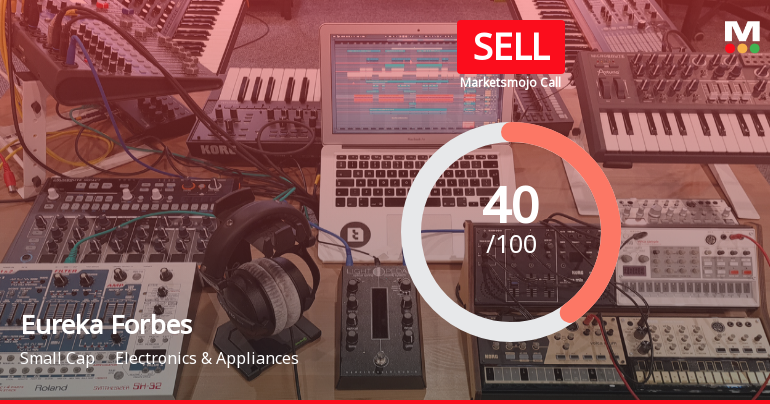
Eureka Forbes Ltd Downgraded to Sell Amid Technical Weakness and Flat Financials
Eureka Forbes Ltd, a key player in the Electronics & Appliances sector, has seen its investment rating downgraded from Hold to Sell as of 18 May 2026. This revision reflects a combination of deteriorating technical indicators, flat financial performance, and concerns over management efficiency, despite some positive long-term growth metrics. The company’s current Mojo Score stands at 40.0, with a Sell grade, signalling caution for investors amid mixed signals across quality, valuation, financial trends, and technicals.
Read More
Announcements
Announcement under Regulation 30 (LODR)-Allotment of ESOP / ESPS
16-Jun-2026 | Source : BSEPursuant to above the Company wishes to inform that it has allotted securities pursuant to exercise of options granted
Intimation Of Schedule Of Analyst/Institutional Investor Meeting Under Regulation 30 Of SEBI LODR
15-Jun-2026 | Source : BSEPlease find attached
Intimation Of Schedule Of Analyst/Institutional Investor Meeting Under Regulation 30 Of SEBI LODR
28-May-2026 | Source : BSEPlease find attached
Corporate Actions

No Upcoming Board Meetings

No Dividend history available

No Splits history available

No Bonus history available

No Rights history available
Quality key factors
Valuation key factors
Technicals key factors
 Technical Indicator Scale: Bearish, Mildly Bearish, Sideways, Mildly Bullish, Bullish Turned
 Shareholding Snapshot : Mar 2026
Shareholding Compare (%holding)
Promoters
53.6592
Held by 14 Schemes (4.67%)
Held by 127 FIIs (13.66%)
Lunolux Limited (62.56%)
Hill Fort India Fund Lp (2.05%)
11.55%
Quarterly Results Snapshot (Consolidated) - Mar'26 - QoQ

QoQ Growth in quarter ended Mar 2026 is 5.94% vs -16.41% in Dec 2025
QoQ Growth in quarter ended Mar 2026 is 409.28% vs -84.07% in Dec 2025
Half Yearly Results Snapshot (Consolidated) - Sep'25
Growth in half year ended Sep 2025 is 12.51% vs 11.88% in Sep 2024

Growth in half year ended Sep 2025 is 27.20% vs 55.73% in Sep 2024
Nine Monthly Results Snapshot (Consolidated) - Dec'25
YoY Growth in nine months ended Dec 2025 is 11.02% vs 11.53% in Dec 2024
YoY Growth in nine months ended Dec 2025 is -2.88% vs 54.76% in Dec 2024
Annual Results Snapshot (Consolidated) - Mar'26
YoY Growth in year ended Mar 2026 is 11.17% vs 11.31% in Mar 2025
YoY Growth in year ended Mar 2026 is -1.08% vs 71.89% in Mar 2025
About Eureka Forbes Ltd

Company Coordinates