Dashboard
Weak Long Term Fundamental Strength with an average Return on Capital Employed (ROCE) of 5.90%
- Low ability to service debt as the company has a high Debt to EBITDA ratio of 4.39 times
The company has declared Negative results for the last 3 consecutive quarters
Stock is technically in a Mildly Bearish range
Underperformed the market in the last 1 year
Stock DNA
Electronics & Appliances
INR 2,233 Cr (Small Cap)
689.00
88
0.00%
0.71
4.27%
2.33
Total Returns (Price + Dividend) 
Epack Durable for the last several years.
Risk Adjusted Returns v/s
Returns Beta

News
Epack Durable Ltd is Rated Strong Sell
Epack Durable Ltd is rated Strong Sell by MarketsMOJO, with this rating last updated on 04 May 2026. However, the analysis and financial metrics presented here reflect the stock's current position as of 21 May 2026, providing investors with the most up-to-date view of the company’s fundamentals, returns, and technical outlook.
Read More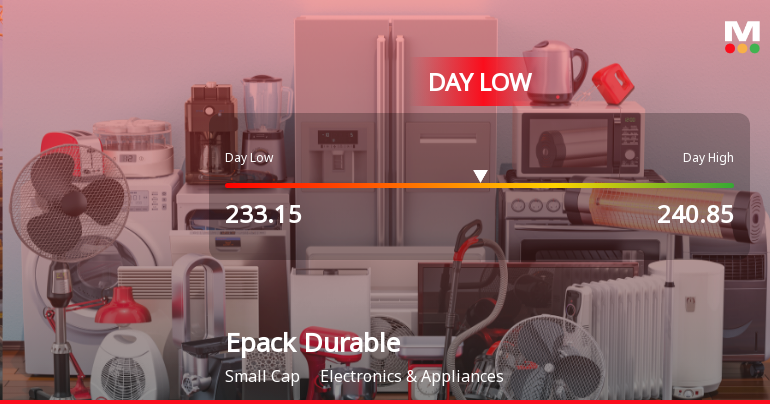
Epack Durable Ltd Hits Intraday Low Amid Price Pressure on 21 May 2026
Epack Durable Ltd experienced a significant intraday decline on 21 May 2026, touching a low of Rs 233.15, down 9.88% from its previous close. The stock underperformed its sector and broader market indices, reflecting immediate price pressures and heightened volatility despite a generally positive market environment.
Read More
Announcements
Announcement under Regulation 30 (LODR)-Change in Management
15-Jun-2026 | Source : BSEEPACK Durable Limited has informed the Exchange about the resignation of Senior Management Personnel.
Announcement Under Regulation 30 Of SEBI Listing Regulations 2015 - General Updates
12-Jun-2026 | Source : BSEEPACK Durable Limited has informed the Exchange about the General Updates.
Announcement under Regulation 30 (LODR)-Earnings Call Transcript
27-May-2026 | Source : BSEEPACK Durable Limited has submitted Transcript of Earning Call held on May 21 2026.
Corporate Actions

No Upcoming Board Meetings

No Dividend history available

No Splits history available

No Bonus history available

No Rights history available
Quality key factors
Valuation key factors
Technicals key factors
 Technical Indicator Scale: Bearish, Mildly Bearish, Sideways, Mildly Bullish, Bullish Turned
 Shareholding Snapshot : Mar 2026
Shareholding Compare (%holding)
Promoters
3.8544
Held by 4 Schemes (4.81%)
Held by 18 FIIs (0.29%)
Sanjay Singhania (8.83%)
Augusta Investments Zero Pte. Ltd. (6.1%)
32.52%
Quarterly Results Snapshot (Consolidated) - Mar'26 - QoQ

QoQ Growth in quarter ended Mar 2026 is 38.18% vs 100.58% in Dec 2025
QoQ Growth in quarter ended Mar 2026 is -99.23% vs 111.64% in Dec 2025
Half Yearly Results Snapshot (Consolidated) - Sep'25
Growth in half year ended Sep 2025 is -23.91% vs 87.18% in Sep 2024
Growth in half year ended Sep 2025 is -95.64% vs 463.02% in Sep 2024
Nine Monthly Results Snapshot (Consolidated) - Dec'25
YoY Growth in nine months ended Dec 2025 is -14.68% vs 70.90% in Dec 2024
YoY Growth in nine months ended Dec 2025 is -81.41% vs 131.17% in Dec 2024
Annual Results Snapshot (Consolidated) - Mar'26
YoY Growth in year ended Mar 2026 is -12.73% vs 52.93% in Mar 2025
YoY Growth in year ended Mar 2026 is -94.09% vs 55.89% in Mar 2025
About Epack Durable Ltd

Company Coordinates