Dashboard
Weak Long Term Fundamental Strength with a 10.19% CAGR growth in Operating Profits over the last 5 years
- Company's ability to service its debt is weak with a poor EBIT to Interest (avg) ratio of 1.97
Flat results in Dec 25
Stock is technically in a Mildly Bearish range
Consistent Underperformance against the benchmark over the last 3 years
Stock DNA
Plastic Products - Industrial
INR 31 Cr (Micro Cap)
17.00
19
0.00%
-0.03
7.57%
1.38
Total Returns (Price + Dividend) 
Duropack for the last several years.
Risk Adjusted Returns v/s
Returns Beta

News

Duropack Ltd Valuation Shifts Signal Elevated Price Risk Amid Mixed Returns
Duropack Ltd, a micro-cap player in the Plastic Products - Industrial sector, has seen a marked shift in its valuation parameters, moving from fair to very expensive territory. This change, coupled with a recent upgrade in its Mojo Grade to Strong Sell, highlights growing concerns over price attractiveness despite a recent 5.03% intraday gain. A detailed analysis of its price-to-earnings (P/E), price-to-book value (P/BV), and other key metrics against historical averages and peer benchmarks reveals the challenges investors face in assessing the stock’s true value.
Read More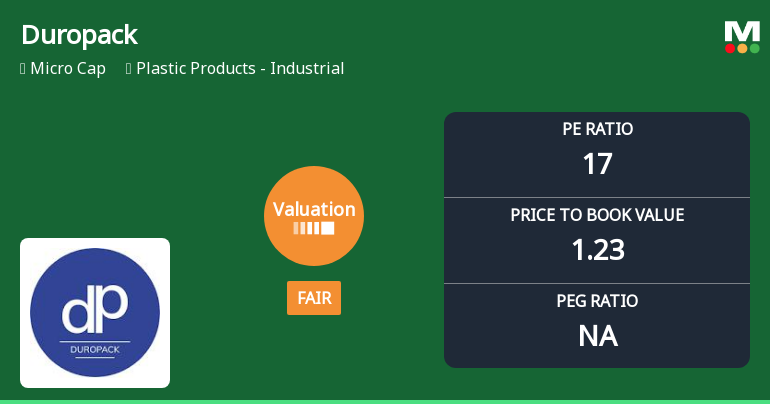
Duropack Ltd Valuation Shifts Amid Mixed Market Performance
Duropack Ltd, a micro-cap player in the Plastic Products - Industrial sector, has witnessed a notable shift in its valuation parameters, moving from an attractive to a fair rating. Despite a recent surge in its share price, the company’s price-to-earnings (P/E) and price-to-book value (P/BV) ratios now align more closely with industry peers, prompting a reassessment of its investment appeal amid broader market challenges and sector dynamics.
Read More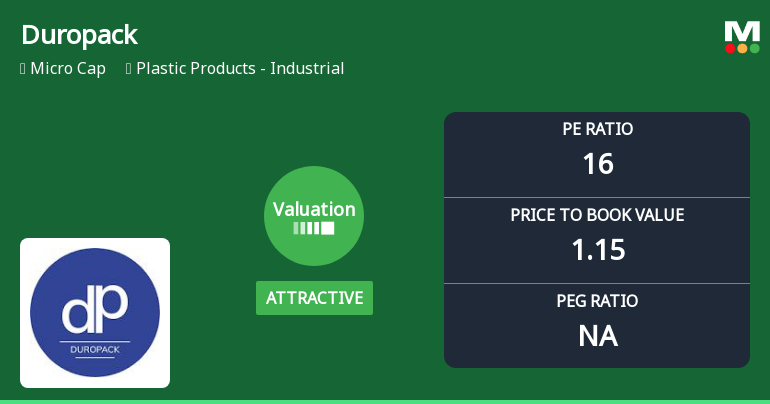
Duropack Ltd Valuation Shifts Signal Renewed Price Attractiveness Amid Market Challenges
Duropack Ltd, a micro-cap player in the Plastic Products - Industrial sector, has seen its valuation metrics shift favourably despite ongoing headwinds in its share price performance. The company’s price-to-earnings (P/E) ratio and price-to-book value (P/BV) have moved into more attractive territory relative to historical averages and peer benchmarks, signalling a potential value opportunity for discerning investors.
Read More Announcements
Announcement under Regulation 30 (LODR)-Newspaper Publication
30-May-2026 | Source : BSENewspaper Advertisement of Audited Financial Result for the quarter and year ended 31st March 2026.
Board Meeting Outcome for To Consider And Approve An Audited Financial Results For The Quarter And Year Ended 31St March 2026
29-May-2026 | Source : BSEThe Board of Directors of the Company at its meeting held today inter alia considered and approved- An Audited financial results for the quarter and year ended on 31st March 2026 as reviewed and recommended by the Audit Committee along with Audit Report issued by the auditors of the Company.
Results-Financial Results For 31St March 2026
29-May-2026 | Source : BSETo consider and approve the audited Financial result for the quarter and year ended 31st March 2026.
Corporate Actions

No Upcoming Board Meetings

No Dividend history available

No Splits history available

No Bonus history available

No Rights history available
Quality key factors
Valuation key factors
Technicals key factors
 Technical Indicator Scale: Bearish, Mildly Bearish, Sideways, Mildly Bullish, Bullish Turned
 Shareholding Snapshot : Mar 2026
Shareholding Compare (%holding)
Promoters
None
Held by 0 Schemes
Held by 0 FIIs
Vivek Jain (17.96%)
Amit Krishnakant Desai (3.03%)
28.06%
Quarterly Results Snapshot (Standalone) - Mar'26 - QoQ

QoQ Growth in quarter ended Mar 2026 is 1.25% vs -1.32% in Dec 2025
QoQ Growth in quarter ended Mar 2026 is 6.52% vs -8.00% in Dec 2025
Half Yearly Results Snapshot (Standalone) - Sep'25
Growth in half year ended Sep 2025 is 24.83% vs -3.58% in Sep 2024

Growth in half year ended Sep 2025 is -45.78% vs 32.80% in Sep 2024
Nine Monthly Results Snapshot (Standalone) - Dec'25
YoY Growth in nine months ended Dec 2025 is 23.43% vs -1.08% in Dec 2024
YoY Growth in nine months ended Dec 2025 is -39.01% vs 15.54% in Dec 2024
Annual Results Snapshot (Standalone) - Mar'26
YoY Growth in year ended Mar 2026 is 21.41% vs 3.66% in Mar 2025
YoY Growth in year ended Mar 2026 is -22.92% vs 11.11% in Mar 2025
About Duropack Ltd


